


Equipment reservation app: prevent conflicts and track returns
Plan an equipment reservation app that prevents double bookings, records returns and damage, and places faulty items on maintenance hold.
Discover the best business analysis tools for 2024. Make informed decisions and optimize your decision-making process with the top tools available.

As businesses continue to evolve, the importance of accurate and efficient analysis becomes increasingly critical. In 2024, the use of business analysis tools will be a vital factor in driving decision-making processes and overall growth. With so many tools available in the market, choosing the right one can be a daunting task. That's why our team of experts has compiled a comprehensive guide to the best business analysis tools for 2024. In this article, we'll explore the top tools available, their features, their their benefits, and how they can help streamline your analysis process. Whether you're a small business owner or an enterprise-level executive, this guide will provide you with the insights and information needed to make informed decisions for your business.
Business analysis is a crucial process that helps organizations identify problems, optimize operations, and make informed decisions. By analyzing data, processes, and systems, business analysts can identify areas of inefficiency and develop solutions to improve overall performance. This process helps organizations to:
In summary, business analysis is essential for organizations to remain competitive, make informed decisions, and optimize their operations.
Business analysts play a critical role in analyzing business requirements to ensure that solutions meet the needs of stakeholders and the organization as a whole. The following are the steps that business analysts typically take to analyze business requirements:
Business analysis tools come in various types, each with its unique functionality that helps businesses make informed decisions and optimize operations. Data visualization tools enable users to represent data in different formats, which can reveal patterns and insights that aid decision-making. Business intelligence tools provide a comprehensive view of an organization's data, enabling users to identify trends and patterns that can inform decisions.
Requirements management tools help business analysts manage and track requirements throughout the development process to ensure that they are properly addressed. Process modeling tools help users identify areas for improvement and optimization in business processes, while predictive analytics tools use historical data to predict future outcomes. Finally, risk management tools help organizations identify and mitigate potential threats to their operations while identifying opportunities to minimize risk and maximize rewards.
We will explore the most popular business analysis tools available today. These tools enable organizations to make sense of complex data and identify opportunities for growth.
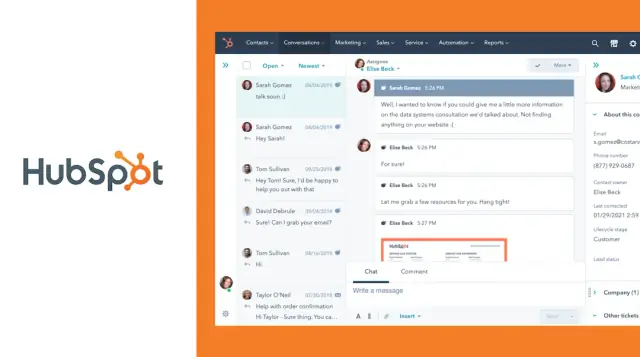
HubSpot is a cloud-based software platform that provides inbound marketing, sales, and customer service solutions. It is designed to help businesses attract, engage, and delight customers by providing a comprehensive set of tools for managing various aspects of the customer journey. The platform includes tools for content management, email marketing, social media marketing, marketing automation, lead management, sales automation, customer service, and analytics. HubSpot's all-in-one platform allows businesses to manage their marketing, sales, and customer service efforts from a single location. The platform is highly customizable, allowing businesses to tailor their strategies to their unique needs and goals.
HubSpot offers several advantages for business analysis, including:
Comprehensive analytics: HubSpot provides robust analytics and reporting tools that allow businesses to track key metrics across all of their marketing, sales, and customer service efforts.
Integration with other tools: HubSpot integrates with a wide range of other tools, including CRM s, social media platforms, and marketing automation software, making it easy for businesses to manage all of their data in one place.
Customizable dashboards: HubSpot allows businesses to create custom dashboards that display the metrics and data that are most important to them, enabling them to make data-driven decisions.
Lead management: HubSpot's lead management tools allow businesses to track and manage leads throughout the customer journey, providing valuable insights into customer behavior and preferences.
Marketing automation: HubSpot's marketing automation tools allow businesses to automate repetitive marketing tasks, such as email campaigns and social media posts, freeing up time for more strategic analysis.
AppMaster.io is a powerful no-code platform with an automatically generating backend. A robust and reliable functionality allows for building server, native mobile, and web applications without writing a single line of code. AppMaster.io generates the source code on the Go language, which you can easily export for independent work. The intuitive platform's studio creates convenient conditions for working with databases, the app's business logic, and design.
AppMaster can be a valuable tool for any business analyst. Instead of requiring developers to create an analytical system that would extract data from multiple sources, analyze, manipulate, and transform it, AppMaster provides a user-friendly visual interface. With AppMaster, business analysts can work with data sources, save them to a local database, modify them, make analytical selections, and build an interface that includes standard graphs, charts, and tables. This allows business analysts to create their own analytical systems without relying on developers.
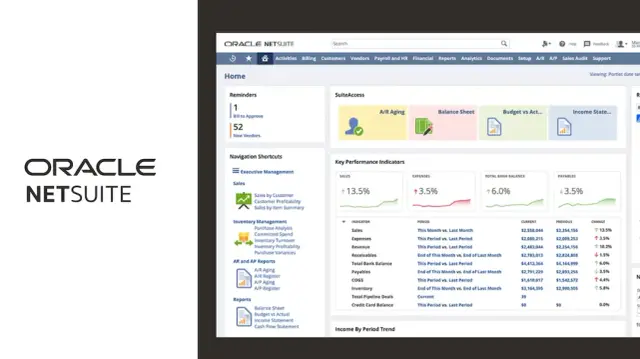
Oracle NetSuite is a cloud-based business management software that provides a range of features for financial management, customer relationship management, and e-commerce. It is designed to help businesses streamline their operations and gain valuable insights into their operations. Oracle NetSuite is highly customizable, allowing businesses to tailor the platform to their unique needs and goals. Some of the key features of Oracle NetSuite include financial management, inventory management, order management, supply chain management, and e-commerce. The platform is also highly scalable, making it suitable for businesses of all sizes. Oracle NetSuite provides businesses with a comprehensive set of tools for managing their operations and gaining valuable insights into their operations.
Oracle NetSuite offers several advantages for business analysis, including:
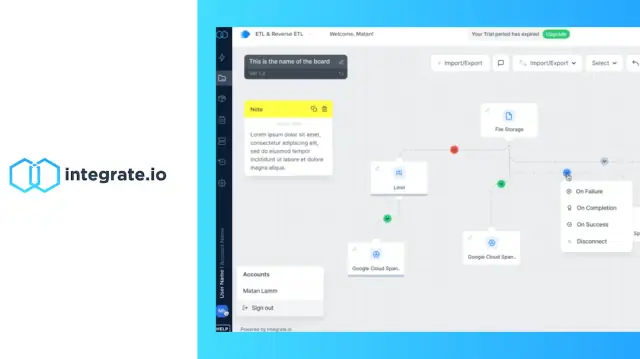
Integrate.io is an innovative cloud-based data integration platform that brings together all your data sources in one place. This platform offers a range of options, including no-code and low-code solutions, making it accessible to everyone.
With an easy-to-use graphic interface, Integrate.io allows you to implement ELT or replication solutions with ease. This platform offers a range of solutions for various industries, including marketing, sales, customer support, and developers.
Integrate.io provides a range of features that will help you to enhance your data management experience. For instance, its marketing analytics solution offers omnichannel marketing, data-driven insights, and features for enriching your marketing database. The customer support analytics solution is designed to help you make better business decisions by providing comprehensive insights.
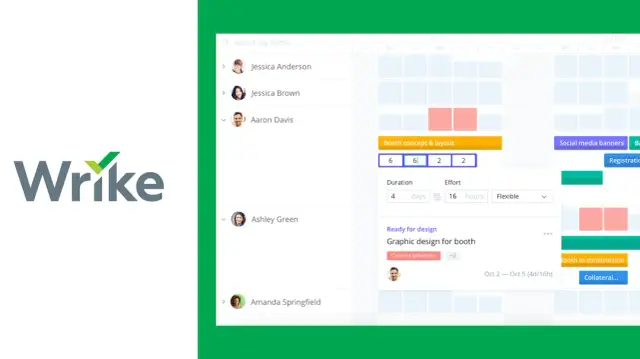
Wrike is a cloud-based project management software that helps teams to collaborate, manage workflows, and achieve their goals more efficiently. This platform is designed to streamline communication and simplify project management, making it an ideal solution for teams of all sizes.
With Wrike, teams can create and assign tasks, set deadlines, track progress, and collaborate in real time. The platform offers a range of features that can be customized to suit different needs, including project templates, Gantt charts, time tracking, and resource management.
Wrike's project templates help teams to get started quickly by providing pre-built templates for common project types. Its Gantt charts visually represent project timelines, while its time-tracking features help teams keep track of billable hours and project costs. Additionally, Wrike's resource management tools help to ensure that team members are allocated to tasks efficiently and effectively.
Wrike is also highly customizable, allowing teams to create custom workflows, fields, and reports to suit their unique needs. This platform offers integrations with other popular tools such as Microsoft Teams, Google Drive, and Salesforce, making it easy to work with the tools you already use.
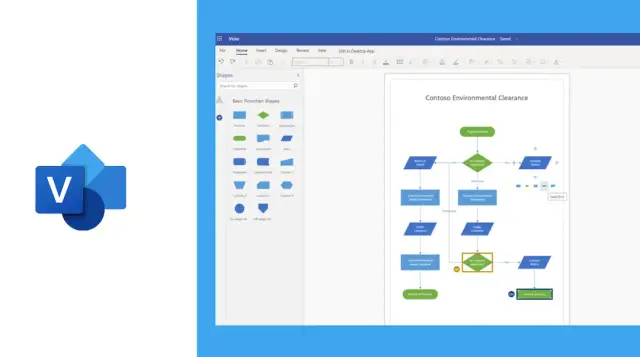
Microsoft Visio is a diagramming and vector graphics application that allows users to create a variety of visual representations of data and information. This powerful tool offers a range of features that make it an ideal solution for creating flowcharts, diagrams, and other visualizations.
With Visio, users can create diagrams from scratch or use pre-built templates to get started quickly. The platform offers a range of shapes and symbols that can be customized to suit specific needs, making it easy to create professional-looking diagrams.
Visio also offers a variety of collaboration and sharing features, including the ability to work on diagrams in real time with other users. Additionally, the platform supports a range of import and export options, allowing users to easily share diagrams with others or integrate them into other applications.
One of the key features of Visio is its ability to create complex diagrams that can help users to understand data and information better. For example, users can create process flow, network, and even 3D diagrams to help visualize complex concepts.
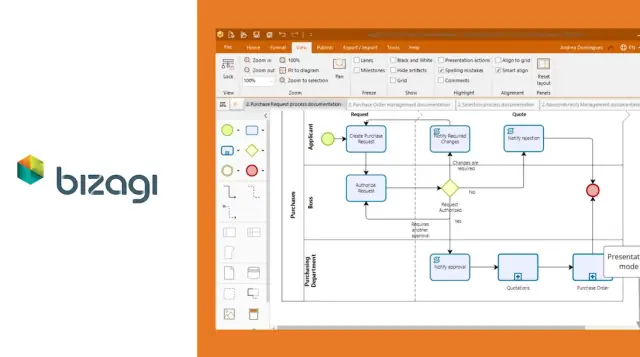
Bizagi is a digital process automation platform that helps organizations improve efficiency and streamline workflows. It offers tools for process modeling, automation, optimization, analytics, and reporting features. Bizagi is an intuitive and powerful solution that can drive digital transformation and optimize processes for improved business outcomes.
There are several pros to using Bizagi for business analysis:
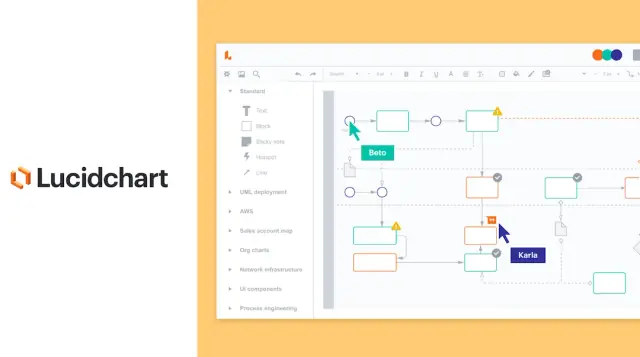
Lucidchart is a web-based diagramming and visualization tool that enables users to create professional diagrams and visualizations quickly and easily. It offers pre-built templates, a drag-and-drop interface, collaboration and sharing features, and the ability to create complex diagrams such as ER diagrams and mind maps. With its intuitive interface and advanced capabilities, Lucidchart is an ideal solution for creating and sharing visual representations of data and information.
Here are some pros of using Lucidchart for business analysis:
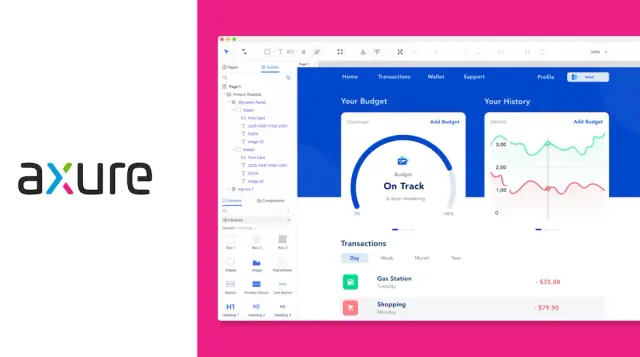
Axure is a wireframing, prototyping, and documentation tool that enables users to create interactive prototypes and diagrams for web and mobile applications. It offers a drag-and-drop interface, customizable templates, collaboration and sharing features, integration with third-party applications, and the ability to create complex interactions and animations. With its powerful capabilities and intuitive interface, Axure is an ideal solution for designers, developers, and product managers looking to create high-quality prototypes and documentation quickly and easily.
Here are some pros of using Axure for business analysis:
Balsamiq is a rapid wireframing tool for web and mobile applications. It offers a drag-and-drop interface with pre-built UI elements that can be customized. Balsamiq allows real-time collaboration, integrates with third-party apps, and creates low-fidelity wireframes for quick testing and validation of design concepts. Overall, Balsamiq is an intuitive and powerful tool for designers, developers, and product managers to create high-quality wireframes and prototypes quickly and easily.
Here are some pros of using Balsamiq for business analysis:
Pencil is an open-source wireframing and prototyping tool that offers a user-friendly interface and built-in UI elements to create diagrams and UI mockups quickly. It features collaboration and sharing options, integrates with third-party apps, and provides reusable templates for efficient wireframing. Pencil is a versatile tool ideal for designers, developers, and product managers seeking to create high-quality graphical elements for web and mobile apps.
Here are some pros of using Pencil for business analysis:
Business Process Model and Notation (BPMN) is a graphical modeling language used to depict business processes visually. It provides a standardized method for modeling and representing business processes, making it easier for stakeholders to understand and communicate about the process.
BPMN is widely used in business analysis and process management to document, analyze, and improve business processes. It allows users to visualize the flow of activities, decision points, and interactions between different process elements, making it easier to identify bottlenecks, inefficiencies, and areas for improvement.
BPMN offers a range of benefits for business analysis, including:
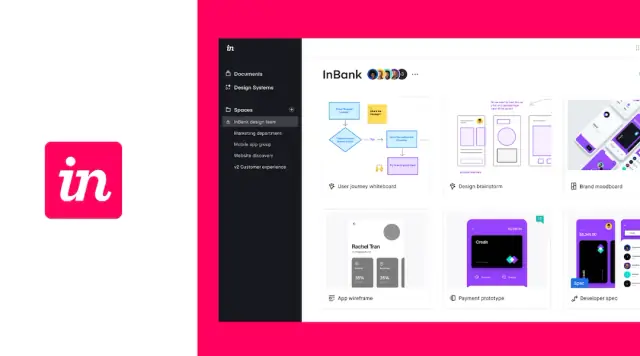
InVision is a cloud-based digital product design platform that allows teams to collaborate on the design of web and mobile applications. It offers a range of features for creating wireframes, interactive prototypes, and animations, as well as collaboration and sharing tools that make it easy to work with other team members and stakeholders.
InVision is widely used in business analysis and product design to:
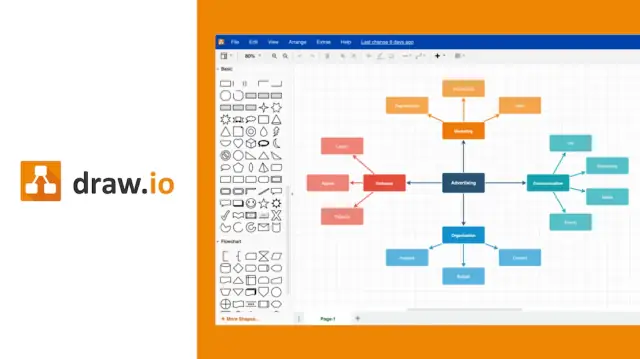
Draw.io is a free, web-based diagramming tool allowing users to create and collaborate on various diagrams, including flowcharts, process maps, and network diagrams. It offers a range of features for creating and customizing diagrams, as well as collaboration and sharing tools that make it easy to work with other team members and stakeholders.
Draw.io is widely used in business analysis and process management to:
IBM Rational Requisite Pro is a requirements management tool that helps teams define, track, and manage requirements throughout the software development lifecycle. It offers a range of features for creating and managing requirements and collaboration and reporting tools that make it easy to work with other team members and stakeholders.
IBM Rational Requisite Pro is widely used in business analysis and software development to:
Blueprint is a software tool that helps with requirements management, traceability, and testing in software development. It provides a collaborative platform for teams to create, manage, and track requirements, as well as automate testing and manage releases.
Blueprint is widely used in business analysis and software development to:
Microsoft Word is a word processing software developed by Microsoft Corporation. It allows users to create, edit, and format text documents, as well as add images, tables, and other elements to enhance the content. Microsoft Word is widely used for various purposes, including writing and editing documents, creating reports, and designing templates. Its features include a wide range of formatting options, spell check, grammar check, and the ability to save files in different formats. Microsoft Word is also commonly used for collaborative work, as it allows users to track changes, add comments, and share documents easily. Overall, Microsoft Word is a versatile and powerful tool that can be used for various purposes in business and other settings.
Microsoft Excel is a spreadsheet software developed by Microsoft Corporation. It allows users to create, manage, and analyze data using spreadsheets, tables, and charts. Microsoft Excel is widely used for various purposes, including financial analysis, budgeting, project management, and data analysis. Its features include a wide range of functions and formulas, data visualization tools, pivot tables, and the ability to sort, filter, and analyze large amounts of data. Microsoft Excel is also commonly used for collaborative work, as it allows users to share workbooks, track changes, and protect data using various security features. Overall, Microsoft Excel is a powerful tool that can be used to manage and analyze data in various business and other settings.
Jira and Confluence are two software tools developed by Atlassian Corporation. Jira is a project management software that allows teams to plan, track, and manage tasks and projects. It is widely used for software development but can be used for various types of projects. Jira's features include task management, agile project management, customizable workflows, reporting, and integration with other tools. It also offers collaboration features that allow teams to communicate, share files, and track progress.
Confluence is a collaboration and documentation software that allows teams to create, organize, and share knowledge. It is widely used for documentation, knowledge management, and team collaboration. Confluence's features include page creation, content organization, commenting, and version control. It also offers integration with other tools, allowing teams to link Confluence pages to Jira issues and other relevant content.
Together, Jira and Confluence provide a comprehensive solution for project management, collaboration, and documentation. They are commonly used together to support agile software development methodologies, but can also be used for various other types of projects and workflows.
Jira and Confluence offer several benefits for business analysis, including:
Jira and Confluence provide business analysts with a powerful set of tools to manage projects, collaborate with teams, document requirements, and support agile methodologies.
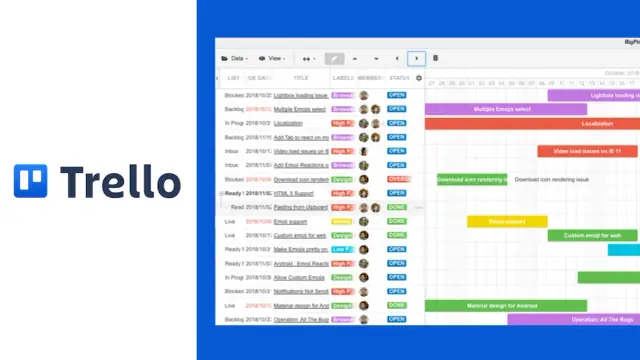
Trello is a web-based project management tool that uses cards, boards, and lists to help teams organize and prioritize tasks and projects. It is a flexible tool that can be used for a wide range of projects, from simple to complex.
Trello's features include customizable boards, cards, and lists, as well as a drag-and-drop interface that makes it easy to move tasks and projects from one stage to another. It also offers collaboration features that allow team members to communicate, share files, and track progress.
Trello is often used by teams to manage agile projects, but can also be used for various other types of projects and workflows. It is particularly useful for business analysis, as it allows business analysts to organize and prioritize project requirements, collaborate with team members, and track progress in real-time.
SQL (Structured Query Language) is a programming language used for managing and manipulating relational databases. It provides a standardized way to interact with databases, allowing users to retrieve, insert, update, and delete data stored in the database.
SQL can be used for a wide range of tasks, including data analysis, data modeling, and database management. It is commonly used in business analysis for tasks such as querying data to gain insights, creating reports and visualizing data.
SQL has a simple syntax and can be easily learned by beginners, making it a popular choice among business analysts and other data professionals. With SQL, business analysts can work with large amounts of data, analyze it efficiently, and gain valuable insights to support business decisions.
Teradata is a cloud-based data warehousing and analytics platform that is designed to handle large-scale data processing and analysis. It offers a wide range of tools and features for data integration, management, and analysis, including SQL querying, data modeling, and machine learning capabilities.
Teradata is particularly useful for businesses that deal with large amounts of data and require high-speed, scalable data processing and analysis. It can be used for a variety of business analytics tasks, including data warehousing, data mining, and predictive analytics.
Teradata offers advanced security features, such as data encryption and access controls, to ensure the confidentiality and integrity of sensitive business data. It also provides robust performance monitoring and management tools, enabling businesses to optimize their data processing and analysis workflows. Teradata is a powerful platform that can help businesses gain insights from their data and make informed decisions based on those insights.
Hive is an open-source SQL querying tool for large-scale data processing and analysis, built on top of Hadoop. It allows users to write HiveQL queries that are translated into MapReduce jobs for execution on Hadoop clusters. Hive is useful for businesses dealing with structured and semi-structured data, providing data modeling and transformation tools for various analytics tasks. Its open-source nature and ease of use make it a popular and cost-effective solution.
Hive offers several benefits for business analysis, including:
Spotfire is a business intelligence and data visualization tool that allows users to analyze and visualize complex data sets quickly and easily. It offers a wide range of interactive dashboards, visualizations, and predictive analytics features that can help businesses gain insights into their data and make better decisions.
Spotfire's user-friendly interface allows users to create interactive dashboards and visualizations with just a few clicks. It supports a wide range of data sources, including Excel, CSV, and Hadoop, making it easy for businesses to access and analyze their data.
Spotfire's predictive analytics capabilities allow businesses to use data to make informed decisions about future trends and opportunities. It also offers collaboration features, allowing multiple users to work together on the same data set, share insights, and collaborate on analyses. Spotfire is particularly useful for businesses that need to analyze large volumes of data quickly and efficiently, such as in the fields of finance, manufacturing, and healthcare.
Python is a popular high-level programming language used for data analysis, machine learning, and AI applications. It has libraries and tools for efficient data analysis, is easy to learn and use, and has a large and active developer community. It's also versatile and used for web development, automation, and rapid prototyping.
Python has several advantages for business analysis, including:
GitHub is a web-based platform used for version control and collaboration on software development projects. It provides a range of features and tools for managing code, collaborating with other developers, and tracking changes to code over time.
GitHub has several advantages for business analysis, including:
Google Analytics is a web analytics service offered by Google that tracks and reports website traffic. It provides businesses with valuable insights into their website's performance and user behavior. Some of the key features and benefits of Google Analytics for business analysis include:
In conclusion, the world of business analysis is constantly evolving, with new tools and technologies emerging all the time. However, the tools we've discussed in this article are some of the most popular and widely used in 2024. Whether you're looking to improve your data visualization, optimize your website, or streamline your project management processes, there is a tool out there to help you achieve your goals.
Ultimately, the key to business analysis success is choosing the right tools for your needs and staying up-to-date with the latest trends and developments in the field. By leveraging the power of these tools and technologies, you can gain valuable insights, make better decisions, and drive business growth in 2024 and beyond.
Business analysis tools are software applications designed to help businesses collect, analyze, and interpret data to inform decision-making and improve operations.
Business analysis tools help businesses make informed decisions based on data analysis, which can lead to better outcomes, increased efficiency, and improved profitability.
Some popular business analysis tools include Microsoft Excel, Tableau, Power BI, QlikView, IBM Cognos Analytics, SAP BusinessObjects, and SAS Analytics.
Microsoft Excel is a powerful tool that can be used for a variety of business analysis tasks, including financial analysis, data visualization, and forecasting. It is also widely available and familiar to many business professionals.
Tableau is a data visualization tool that allows users to create interactive charts, graphs, and dashboards to help businesses understand their data. It can be used to identify trends, patterns, and outliers in data.
Power BI is a business analytics service that provides interactive visualizations and business intelligence capabilities with an interface simple enough for end users to create their own reports and dashboards. Power BI can be used to connect data from various sources and create custom visualizations.
QlikView is a business intelligence platform that allows businesses to consolidate data from various sources into a single dashboard for analysis. It allows users to visualize data through interactive dashboards, charts, and graphs and can be used for data discovery, exploration, and analysis.
IBM Cognos Analytics is a business intelligence platform that allows businesses to create custom reports, dashboards, and analytics for decision-making. It can be used to analyze data from multiple sources and provides a range of visualization options.
SAP BusinessObjects is a business intelligence platform that provides a range of tools for data visualization, reporting, and analysis. It can be used to analyze data from various sources and provides features for data discovery, exploration, and collaboration.
SAS Analytics is a data analytics tool suite allowing businesses to analyze data, build predictive models, and automate data-driven decisions. It provides a range of tools for data visualization, exploration, and reporting and can be used to analyze data from various sources.
The tools listed here are suitable for a wide range of businesses, but the choice of tool will depend on the specific needs and goals of the business. It is important to carefully evaluate each tool before selecting one for a particular use case.
Experiment with AppMaster with free plan.
When you will be ready you can choose the proper subscription.


