


Equipment reservation app: prevent conflicts and track returns
Plan an equipment reservation app that prevents double bookings, records returns and damage, and places faulty items on maintenance hold.
Discover Business Intelligence strategies for data-driven decision-making. Learn how BI tools transform businesses, enhance efficiency, and drive growth.

Business Intelligence (BI) has become indispensable to modern businesses in our ever-evolving digital landscape. The ability to harness data for informed decision-making is no longer a luxury but a necessity for organizations striving to excel and outpace the competition.
In this comprehensive discussion, we will examine the fundamentals ofBI, its crucial elements, and the diverse tools and technologies that enable businesses to utilize their data effectively. Additionally, we will explore the primary benefits of adoptingBI strategies, emphasizing how they can enhance efficiency, foster innovation, and facilitate growth across various industries.
Business intelligence (BI) is a comprehensive term for collecting, analyzing, and presenting relevant data to support informed decision-making within organizations. Utilizing technology, processes, and best practices,BI enables businesses to transform raw data into actionable insights, improving overall efficiency and competitiveness. This process often involves using specialized software tools for data extraction, data warehousing, data mining, and data visualization, which facilitate a better understanding of business performance, trends, and patterns. Companies can then leverage this information to optimize operations, identify new opportunities, and gain a competitive edge. According to a survey by Dresner Advisory Services, 78% of enterprises considerBI"critical" or"very important" for their success, highlighting its significance in today's data-driven business landscape.
Business intelligence (BI) employs a systematic approach to collect, integrate, analyze, and present data, enabling organizations to make well-informed decisions. The process generally involves the following steps:
Data collection: Data is gathered from various sources, including internal systems like ERP, CRM, and financial databases, as well as external sources such as social media, market research, or industry reports.
Data integration: Collected data is then integrated and consolidated to create a unified and consistent data repository, typically a data warehouse or a data lake. This step often involves data cleansing, deduplication, and transformation to ensure data quality and compatibility.
Data analysis: Using advanced analytical tools and techniques, such as data mining, machine learning, and statistical analysis, the integrated data is examined to uncover hidden patterns, trends, and correlations. These insights can be used to address specific business questions or to identify potential opportunities and risks.
Data visualization and reporting: The analyzed data is transformed into easily understandable visual representations, such as charts, graphs, and dashboards. These visualizations help decision-makers quickly grasp the insights derived from the data analysis and make informed decisions.
Decision-making and action: Based on the insights gained from theBI process, organizations can make data-driven decisions and take appropriate actions to optimize their operations, enhance their products or services, and improve overall business performance.
Continuous improvement: TheBI process is cyclical and iterative, with organizations continuously collecting new data, updating their analyses, and refining their strategies. This approach allows businesses to adapt to changing market conditions and maintain a competitive edge.

By following these steps, business intelligence empowers organizations to leverage data to drive strategic decisions, improve operational efficiency, and gain a competitive advantage.
Business Intelligence (BI), Data Analytics, and Business Analytics are interconnected concepts that help organizations make informed, data-driven decisions. While they have some overlap, each has its unique focus and objectives. Here's how they work together:
Business Intelligence (BI):BI focuses on delivering insights from historical and current data to comprehensively understand business performance. It primarily uses descriptive analytics to create visualizations, reports, and dashboards that enable decision-makers to assess the organization's health and identify trends.BI serves as a foundation for data-driven decision-making by offering a clear view of what has happened or is happening within a business.
Data Analytics: Data Analytics is a broader term encompassing various techniques used to analyze data, including descriptive, diagnostic, predictive, and prescriptive analytics. WhileBI focuses on descriptive analytics, Data Analytics goes beyond to explore the causes of events (diagnostic), forecast future trends (predictive), and recommend optimal actions (prescriptive). Data Analytics empowers organizations to answer questions like"Why did this happen?","What is likely to happen?", and"What should we do about it?".
Business Analytics: Business Analytics is an umbrella term that includes bothBI and Data Analytics, focusing on applying analytical techniques to solve specific business problems or optimize business processes. It leverages data to drive strategic and operational decisions to enhance overall business performance. Business Analytics bridges the gap between raw data and actionable insights by combiningBI and Data Analytics methods.
WhenBI, Data Analytics, and Business Analytics work together, they create a powerful synergy that allows organizations to:
Monitor and assess business performance through historical and real-time data.
Identify trends, patterns, and anomalies to uncover hidden opportunities or potential issues.
Diagnose the root causes of problems and determine the factors influencing business performance.
Forecast future outcomes and assess the potential impact of different scenarios.
Recommend optimal actions based on data-driven insights, leading to better decision-making.
Business Intelligence (BI) offers numerous benefits to organizations by enabling them to make data-driven decisions, optimize operations, and maintain a competitive edge. Some of the key benefits ofBI include:
Improved decision-making: By providing timely and accurate insights,BI helps decision-makers make more informed choices, reducing the reliance on gut feelings or guesswork.
Enhanced operational efficiency:BI tools can identify inefficiencies, bottlenecks, or resource constraints, enabling organizations to streamline processes, reduce costs, and optimize resource allocation.
Increased revenue and profitability: With insights into customer preferences, market trends, and sales performance, businesses can tailor their offerings, pricing strategies, and marketing campaigns, ultimately driving revenue growth and higher profits.
Better customer understanding:BI enables organizations to analyze customer data, identifying patterns and trends that help tailor products, services, and marketing efforts to meet customer needs and enhance customer satisfaction.
Competitive advantage: By providing insights into market trends, competitor performance, and industry dynamics,BI allows businesses to adapt to the changing environment and maintain a competitive edge.
Forecasting and risk management: BI's predictive capabilities help organizations anticipate future trends, identify potential risks, and develop contingency plans, making them better prepared for uncertainties. Data-
Driven culture: ImplementingBI encourages a culture of data-driven decision-making, fostering collaboration and enhancing overall organizational performance.
Regulatory compliance and reporting:BI tools can generate accurate and timely reports, helping organizations comply with regulatory requirements and ensuring transparency.
Employee empowerment: By providing access to relevant data and insights,BI empowers employees to make better decisions in their respective roles, promoting ownership and accountability.
Innovation and growth: The insights fromBI can spark new ideas, enabling organizations to identify opportunities for innovation, expansion, or diversification, driving long-term growth.
By leveraging the power ofBI, organizations can transform raw data into valuable insights that drive informed decision-making, optimize operations, and fuel sustainable growth.
Business Intelligence (BI) analysis can be categorized into various types, depending on the analytical techniques employed and their objectives. The primary categories ofBI analysis are:
Descriptive Analysis: Descriptive analysis focuses on summarizing historical data to provide an understanding of what has happened in the past. It involves using basic statistical measures, such as mean, median, mode, standard deviation, and frequency distributions, as well as data visualization techniques like bar charts, pie charts, and line graphs. Descriptive analysis is the foundation ofBI, helping organizations assess their past performance and identify trends or patterns.
Diagnostic Analysis: Diagnostic analysis delves deeper into the data to determine the causes of observed events or issues. It involves techniques like drill-down, data mining, and correlation analysis, allowing organizations to understand why specific trends or patterns occurred. Diagnostic analysis helps identify the underlying factors influencing business performance and enables informed decision-making.
Predictive Analysis: Predictive analysis uses advanced statistical models, machine learning algorithms, and data mining techniques to forecast future trends, events, or behaviors based on historical data. By analyzing patterns and relationships within the data, predictive analysis enables organizations to anticipate future outcomes, assess potential risks, and identify growth opportunities. Common predictive analysis techniques include regression, time series, and decision trees.
Prescriptive Analysis: Prescriptive analysis goes beyond predicting future outcomes to recommend specific actions that can optimize those outcomes. It uses optimization algorithms, simulation techniques, and decision analysis to determine the best course of action under various scenarios. Prescriptive analysis helps organizations make data-driven decisions that maximize benefits and minimize risks.
Geospatial Analysis: Geospatial analysis incorporates geographic data and visualizations, such as maps and heat maps, to provide location-based insights. This type of analysis can help organizations identify spatial patterns, understand regional trends, and optimize the allocation of resources across different locations.
Real-time Analysis: Real-time analysis involves continuously processing and monitoring data as it is generated, allowing organizations to gain instant insights and respond to events as they occur. This type of analysis is particularly useful in dynamic environments, such as monitoring social media sentiment or tracking the performance of online marketing campaigns.
Business Intelligence (BI) systems and tools are designed to help organizations collect, store, analyze, and visualize data to facilitate informed decision-making. These tools come in various forms, with different features and capabilities to cater to diverse business needs. Some popularBI systems and tools include:
Microsoft PowerBI: A versatileBI tool that offers data integration, analytics, and visualization capabilities, allowing users to create interactive dashboards and reports. PowerBI is known for its ease of use, robust integration with other Microsoft products, and scalability.
Tableau: A leadingBI platform that specializes in data visualization and exploration, enabling users to create visually appealing, interactive dashboards and reports.Tableau is known for its user-friendly interface, powerful data analytics features, and extensive community resources.
QlikView andQlik Sense: Qlik'sBI solutions utilize an associative data model, allowing users to explore data relationships and discover insights through a unique, interactive experience.QlikView focuses more on guided analytics, whileQlik Sense offers self-service data exploration and visualization.
SAP BusinessObjects: A comprehensiveBI suite from SAP offering a wide range of tools for data integration, analytics, and reporting.SAP BusinessObjects caters to organizations of various sizes and industries with features like customizable dashboards, ad-hoc reporting, and mobile access.
IBM Cognos Analytics: A powerfulBI platform from IBM that provides advanced analytics, data integration, and visualization capabilities. Cognos Analytics is known for its AI-driven features, robust data governance, and seamless integration with various data sources.
Looker: A modernBI platform that emphasizes data exploration, collaboration, and real-time insights.Looker utilizes a data modeling language called LookML, allowing users to create reusable data models and define business logic. It offers strong integration with various databases and cloud platforms.
MicroStrategy: A comprehensiveBI solution that provides a wide range of features, including data integration, analytics, visualization, and mobile capabilities.MicroStrategy is known for its enterprise-grade security, scalability, and big data and cloud-based deployment support.
Domo: A cloud-basedBI platform that emphasizes real-time data access, collaboration, and mobile accessibility.Domo offers a user-friendly interface, robust data integration capabilities, and pre-built connectors for various data sources and third-party applications.
Sisense: ABI platform that combines data integration, analytics, and visualization in a single solution.Sisense is known for its ease of use, powerful data analytics engine, and customizable dashboards, making it suitable for technical and non-technical users.
Oracle Analytics Cloud: A comprehensiveBI solution from Oracle that offers a wide range of features, including data integration, advanced analytics, and interactive visualization.Oracle Analytics Cloud is known for its seamless integration with other Oracle products, AI-driven insights, and support for hybrid cloud deployments.
When selecting aBI tool, organizations should consider their specific business needs, the tool's features and capabilities, ease of use, scalability, integration with existing systems, and cost.
When choosing aBI system or tool, it's essential to consider several factors to ensure the solution meets your organization's unique needs and drives business success. Start by identifying the specific business goals you want to achieve with theBI tool and align its capabilities with those objectives. Usability and intuitiveness are important as they will directly impact user adoption and productivity, so look for a user-friendly interface and accessible features.
Seamless data integration is essential for creating a comprehensive data repository, so evaluate the tool's ability to integrate with various data sources. Also, assess the tool's scalability and performance to ensure it can handle growing data volumes and user requirements. Visualization and reporting capabilities are crucial since they help users comprehend and communicate insights, so find a solution that offers customizable visualizations and robust reporting options.
Advanced analytics features, such as predictive and prescriptive, can help your organization anticipate trends and make data-driven recommendations. Additionally, consider the tool's features for collaboration and data governance and support for mobile devices and remote access. The vendor's reputation, support offerings, and user community should also be evaluated, as they can provide valuable resources.
Lastly, consider the total cost of ownership of theBI tool, including licensing, implementation, maintenance, and training costs. Compare these costs to the expected return on investment to ensure the investment will deliver tangible benefits to your organization. By carefully evaluating these factors, you can select aBI system or tool that optimizes the value of your data and enhances your decision-making processes.
No-code platforms and tools can significantly benefit organizations seeking to implementBI systems and solutions, particularly those with limited technical resources or expertise. By allowing users to create applications, automate processes, and analyze data without writing a single line of code,no-code solutions empower non-technical users and democratize access to valuableBI insights.
Here's howno-code can help:
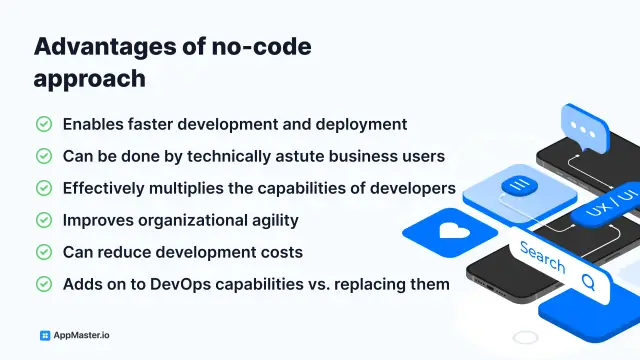
Faster development and deployment:No-code platforms enable users to quickly build and deployBI applications, reducing the time and effort required for traditional development processes. By leveraging visual development interfaces, drag-and-drop components, and pre-built templates, organizations can rapidly create customBI solutions to address their unique needs.
Lower costs:No-code platforms can reduce the overall costs associated withBI implementation and maintenance by minimizing the need for skilled developers or extensive training. This can makeBI solutions more accessible to smaller organizations or those with limited budgets.
Enhanced collaboration:No-code platforms encourage collaboration between technical and non-technical stakeholders, as users from different backgrounds can contribute to developingBI applications. This fosters a shared understanding of business objectives, promotes a data-driven culture, and ensures that theBI solutions align with users' needs and expectations.
Empowering non-technical users:No-code tools enable non-technical users, such as business analysts or subject matter experts, to create their ownBI applications and access data insights without relying on IT or development teams. This democratizes access toBI capabilities and encourages broader adoption across the organization.
Flexibility and adaptability:No-code platforms allow organizations to quickly adapt and iterate theirBI applications in response to changing business needs or market conditions. Users can easily modify existing applications or create new ones to address emerging challenges, ensuring that theBI solutions remain relevant and effective.
Increased innovation: By lowering the barriers to entry and empowering a diverse range of users to createBI applications,no-code platforms can stimulate innovation and creativity within an organization. With more people able to access and analyze data, new ideas and insights can emerge, driving business growth and success.
No-code platforms and tools as AppMaster can help organizations unlock the potential ofBI by streamlining development processes, reducing costs, and empowering non-technical users to create and deployBI solutions. By leveragingno-code technology, organizations can enhance decision-making, optimize operations, and maintain a competitive edge in today's data-driven world.
Business Intelligence (BI) and Big Data are interconnected concepts that cooperate to help organizations make data-driven decisions, optimize operations, and maintain a competitive edge in the data-driven world.BI encompasses the processes, tools, and technologies used to collect, analyze, and visualize data to generate actionable insights. Meanwhile, Big Data refers to the massive and complex datasets generated at high volumes and velocities, characterized by variety, veracity, and value.
The relationship betweenBI and Big Data is multifaceted. Big Data technologies likeHadoop andSpark provide the infrastructure and tools necessary to store, process, and manage large datasets, forming the foundation forBI systems. These systems require efficient and scalable data processing capabilities to handle the volume, variety, and velocity of Big Data.
TraditionalBI techniques may not suffice to analyze the complexity and scale of Big Data. Advanced analytics techniques like machine learning, natural language processing, and graph analytics allow organizations to extract meaningful insights from Big Data, enhancing theirBI capabilities. One of the key challenges of Big Data is the need for real-time or near-real-time processing and analysis.BI tools and systems supporting real-time analytics, like streaming data processing and in-memory analytics, help organizations make timely and informed decisions based on current data.
Big Data often originates from various sources and formats, necessitating data integration and transformation processes to create a unified and consistent view of the data.BI tools and platforms, like ETL (Extract, Transform, Load) tools and data warehousing solutions, help organizations prepare and manage their Big Data for effective analysis and reporting. Given the scale and complexity of Big Data, data visualization techniques play a crucial role in presenting insights in an easily understandable and digestible format. AdvancedBI tools offer various data visualization options that help users explore and interpret Big Data insights effectively.
BI and Big Data are closely linked, withBI tools and processes harnessing the power of Big Data to provide organizations with actionable insights that drive informed decision-making, optimize operations, and fuel sustainable growth. By integratingBI and Big Data technologies, organizations can unlock their data's full potential and maintain a competitive edge in an increasingly data-driven business environment.
The future of Business Intelligence (BI) will be influenced by many factors, including continuous technological advancements, increasing data volumes, and evolving business needs. These factors will shape the way organizations leverage data to make informed decisions.
One of the key aspects of the future ofBI is the integration of artificial intelligence and machine learning, which will automate data analysis and provide predictive and prescriptive insights. This will help organizations anticipate future trends, identify potential risks, and make proactive, data-driven decisions. Augmented analytics, which combines AI and machine learning withBI tools, will become more prevalent, assisting in automating data preparation, analysis, and visualization while reducing human bias and providing more accurate and actionable insights.
As the need for timely decision-making increases, organizations will prioritize real-time analytics capabilities in theirBI tools. This will enable businesses to continuously monitor operations, customer behavior, and market trends, allowing them to respond promptly to emerging opportunities or challenges. Additionally, self-serviceBI tools will become more user-friendly, enabling non-technical users to access, analyze, and visualize data without relying on IT or data experts. This will encourage data-driven decision-making across various levels and functions within organizations.
Data governance and privacy will be more prominent inBI initiatives, given the increasing focus on data privacy regulations and concerns. Organizations must implement robust data governance frameworks and privacy measures to ensure compliance and maintain customer trust. Integrating natural language processing (NLP) inBI tools will enable users to interact with data using natural language queries, simplifying the data exploration and analysis process.
The adoption of cloud-basedBI solutions will continue to grow, driven by the need for scalability, cost efficiency, and ease of access. Cloud-basedBI tools will allow organizations to easily deploy, maintain, and scale theirBI systems while ensuring data accessibility across various devices and locations. The proliferation of IoT devices and sensors will generate even more data, requiring organizations to adopt edge analytics to process and analyze data closer to its source, reducing latency and enabling real-time decision-making.
Lastly, futureBI tools will emphasize collaboration, enabling users to share insights, annotations, and data visualizations with colleagues across the organization. SocialBI features will facilitate collective decision-making and foster a data-driven culture.
In summary, the future role of Business Intelligence will be shaped by a combination of technological advancements, evolving business needs, and the increasing importance of data in decision-making. Organizations that embrace these changes and adapt theirBI strategies accordingly will be better positioned to harness the power of data and drive success in an increasingly competitive landscape.
Experiment with AppMaster with free plan.
When you will be ready you can choose the proper subscription.


