


Equipment reservation app: prevent conflicts and track returns
Plan an equipment reservation app that prevents double bookings, records returns and damage, and places faulty items on maintenance hold.
Learn to optimize your Java applications with advanced performance techniques. Discover tips for garbage collection, concurrent programming, and memory management.

Java performance optimization is the process of tuning Java applications to improve their speed, efficiency, and responsiveness. This encompasses various techniques and tools, from applying best practices in code design and programming to monitoring and profiling applications for bottlenecks and inefficiencies.
Optimizing Java performance has several benefits. By increasing the efficiency of a Java application, you can reduce resource consumption, such as CPU and memory usage, potentially reducing hardware requirements and related costs. Improved performance can also lower response times of the application, delivering a better and more satisfying user experience.
In addition, performance optimization can help enhance the scalability of your Java applications, allowing them to handle larger workloads and serve more users. This is particularly important in today's growing digital economy, where businesses rely on fast and responsive applications to stay competitive.
By implementing Java performance optimization techniques, you can maintain the quality of your application and meet the demands of your users. This also helps minimize the chances of application failures or crashes due to inefficient code and poor resource management, ensuring continuous and reliable operation.
Garbage collection (GC) is a crucial component of the Java Runtime Environment (JRE). It automatically handles memory management, removing objects from memory when they are no longer in use. This helps prevent memory leaks and out-of-memory errors that can lead to performance issues. Still, garbage collection can also introduce performance overhead if not configured correctly.
There are several garbage collectors available in the JRE, each with its own algorithms and trade-offs. Some widely-known collectors include the Serial GC, Parallel GC, Concurrent Mark-Sweep (CMS) GC, and G1 GC. Choosing the correct garbage collector for your application is a vital step in Java performance optimization.
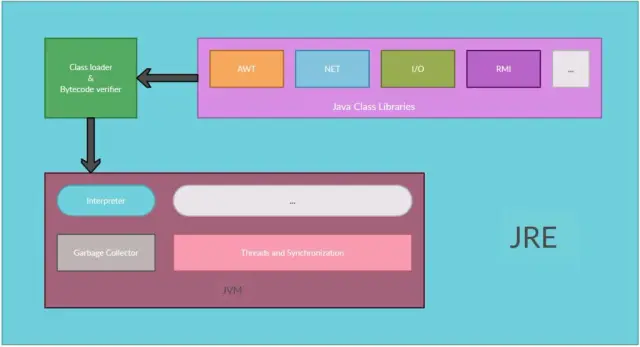
Image source: javaindia.in
To optimize garbage collection, consider the following tips:
Effective memory management is crucial for optimal Java application performance. Memory leaks, inefficiencies, and bottlenecks can lead to slowdowns, crashes, and other undesired behaviors. To optimize memory usage and management in your Java application, consider the following techniques:
int instead of Integer when working with integers.ArrayList instead of LinkedList when random-access performance is a priority, as ArrayList consumes less memory than LinkedList.By incorporating these memory management techniques into your Java application, you can improve its performance and resource efficiency, contributing to a better user experience and more scalable systems.
Concurrency is an essential aspect of modern programming, significantly impacting performance, especially in multi-core systems. Java offers rich support for concurrent programming, enabling you to build faster and more efficient applications. Implementing concurrent programming techniques in Java can increase scalability, decrease execution time, and optimize resource usage. To take full advantage of these benefits, you should familiarize yourself with the following concepts:
Java applications run on multiple threads, allowing different parts of your application to execute simultaneously. Threads can be managed manually or using executors. The java.util.concurrent.Executor framework provides several utility classes to manage threads effectively and simplify concurrent programming. Using the ThreadPoolExecutor class, you can create thread pools, a collection of worker threads that handle tasks. Thread pools can help increase performance by reducing the overhead of creating and destroying threads for each task.
When more than one thread accesses shared resources, it is crucial to ensure the integrity of the data by managing access properly. Java provides various synchronization constructs to help you achieve this, such as the synchronized keyword, locks, and semaphores. For better performance, consider using the higher-level java.util.concurrent.locks package, which offers advanced locking mechanisms like ReentrantLock and ReadWriteLock. These options provide improved control over lock behavior compared to the traditional synchronized blocks, increasing efficiency in various use cases.
Java's atomic classes, such as AtomicInteger and AtomicLong, provide thread-safe mechanisms for performing atomic operations on numerical values. They can improve performance by avoiding the need for blocking or synchronization in certain situations. Java also provides concurrent data structures optimized for use in multi-threaded environments, located in the java.util.concurrent package. These data structures, such as ConcurrentHashMap and CopyOnWriteArrayList, are designed to offer better performance under concurrent access and reduce the need for manual synchronization.
Java's Future and CompletableFuture classes provide convenient and powerful tools to manage the result of asynchronous computations. Using these constructs, you can execute tasks in parallel and later aggregate the results efficiently. They can enhance application performance, particularly when handling computationally intensive tasks or interacting with external systems that require blocking or waiting.
Profiling is a crucial aspect of optimizing your Java application's performance. Profilers help you monitor and analyze your application's runtime behavior, revealing potential bottlenecks and inefficiencies. By identifying these issues, you can address them and significantly improve the performance. Several Java profiling tools can analyze various aspects of application performance, such as CPU usage, memory allocation, garbage collection, and thread execution. Some popular Java profilers include:
To make the best use of Java profilers, follow these best practices:
While optimizing your Java application for better performance is vital, it's also essential to embrace modern tools and technologies that can further enhance your application's efficiency. AppMaster, a leading no-code development platform, provides a powerful and efficient way to create web, mobile, and backend applications that can integrate seamlessly with your Java-based systems.
With AppMaster's no-code platform, you can visually design data models, API endpoints, and business processes, significantly reducing development time and costs. By incorporating AppMaster into your application stack, you can create highly scalable, fast, and efficient applications, further improving your Java application's performance.
Using the AppMaster platform allows you to easily extend or enhance your Java applications with a vast ecosystem of no-code capabilities, streamlining integration and development efforts. This approach ensures that your Java application performs at its best, delivering a superior user experience and boosting efficiency.
Optimizing Java performance is crucial for delivering efficient, scalable, and responsive applications. By understanding and implementing concurrent programming techniques, leveraging profiling tools, and using modern development platforms like AppMaster, you can significantly improve your Java application's performance, leading to satisfied users and better system health.
Improving the performance of your Java applications is an ongoing process that involves following best practices, adopting proven techniques, and leveraging appropriate tools. In this section, we will explore some key best practices for Java optimization to boost your application's performance.
Writing efficient and clean code is the foundation of optimized Java applications. Make sure your code is modular, readable, and maintainable. Follow coding conventions, use meaningful variable and function names, and keep functions concise. Use design patterns and standard algorithms where applicable, and avoid reinventing the wheel.
The final keyword enables you to declare variables, methods, and classes as immutable, which can help improve performance in certain scenarios. At the same time, using it excessively can lead to inflexibility and code complexity. Apply the final keyword judiciously to specific variables or methods that should remain unchanged, but avoid overusing it.
Efficient data structures can contribute significantly to the performance of your Java applications. Carefully consider the use of different data structures such as ArrayList, LinkedList, HashMap, TreeMap, and HashSet based on your application's requirements. Remember that each data structure has its own characteristics that can impact performance, memory usage, and ease of programming.
Lazy initialization is a technique where you postpone the creation and initialization of objects until they're actually needed. This can help reduce memory consumption and startup time. But be cautious when using lazy initialization with multi-threaded applications, as it can lead to synchronization issues.
Frequent object creation can put a strain on the garbage collector and cause performance problems in your Java applications. To minimize object creation, consider the following practices:
Caching is a smart technique to boost the performance of your Java applications by storing the results of expensive computations or frequently accessed resources. Utilize caches for frequently accessed data or calculations, reducing the need for redundant processing or database queries. Look into libraries like Ehcache or Google Guava for ready-to-use caching solutions.
Synchronization and concurrency can have a significant impact on your Java application's performance. Embrace parallelism using multi-threading, the Java Concurrency API, or third-party libraries like Akka to use modern multi-core processors. When using synchronization, be mindful of potential bottlenecks and performance penalties incurred due to excessive locking.
Monitoring and profiling your Java application is crucial for identifying potential bottlenecks and performance issues. Use tools like VisualVM, JProfiler, or Yourkit to analyze various aspects of your application, such as memory usage, CPU load, and garbage collection behavior. Keep an eye on performance metrics and make data-driven optimization decisions.
Conducting regular code reviews and refactoring your codebase helps maintain your Java application's performance by addressing inefficient code, fixing bugs, and eliminating performance bottlenecks. Encourage a culture of continuous improvement, where team members proactively seek areas for performance enhancement.
Optimizing Java performance is an iterative process that involves following best practices, scrutinizing your code, and utilizing appropriate tools and techniques. By adopting these practices and continually monitoring the performance of your Java applications, you can ensure their efficiency and deliver a superior user experience. Moreover, no-code platforms like AppMaster can provide a significant performance boost to your Java-based systems.
Java performance optimization refers to the process of improving the efficiency, speed, and responsiveness of Java applications by implementing various techniques, best practices, and tools.
Optimizing Java performance is crucial since it can help reduce resource consumption, lower response times, enhance application scalability and offer a better user experience.
Garbage collection can be optimized in Java by choosing the right garbage collector, adjusting heap size, tuning garbage collection parameters, and minimizing object creation.
To improve Java memory management, you can adopt techniques such as object pooling, using primitive data types, optimizing data structures, and applying escape analysis.
Concurrent programming in Java involves structuring your code to handle multiple tasks simultaneously using threads, which can lead to improved performance, especially in parallel processing and multi-core systems.
Java profiling tools include VisualVM, JProfiler, Yourkit, and NetBeans Profiler, among others. These tools help in analyzing various aspects of Java applications to identify potential performance bottlenecks and inefficiencies.
AppMaster, a no-code platform, enables you to create efficient web, mobile, and backend applications that can integrate seamlessly with Java-based systems. This can help enhance your Java application's overall performance.
Java optimization best practices include writing efficient code, monitoring and profiling your application, optimizing memory management and garbage collection, and embracing concurrent programming techniques.
Experiment with AppMaster with free plan.
When you will be ready you can choose the proper subscription.


