


Equipment reservation app: prevent conflicts and track returns
Plan an equipment reservation app that prevents double bookings, records returns and damage, and places faulty items on maintenance hold.
Learn how to create custom interactive maps for your website or project. Engage your audience with personalized and dynamic map visuals.

Dive into this comprehensive guide on crafting custom interactive maps designed to enrich your digital content and offer your audience a captivating and immersive experience. As the world grows more interconnected and reliant on data, the significance of geospatial visualization continues to rise. Custom interactive maps empower businesses, researchers, and content creators to transform intricate data sets into visually striking and easily comprehensible information.
We will explore the realm of custom interactive maps, examining their advantages while providing a detailed tutorial to build your own. We will touch upon various mapping platforms, libraries, and tools tailored to different skill levels and needs. Furthermore, we will address best practices for designing visually appealing and user-friendly maps that convey your message effectively. Regardless of your experience level, this guide aims to provide you with the expertise and resources needed to develop compelling, custom interactive maps that engage your audience and elevate your digital content.
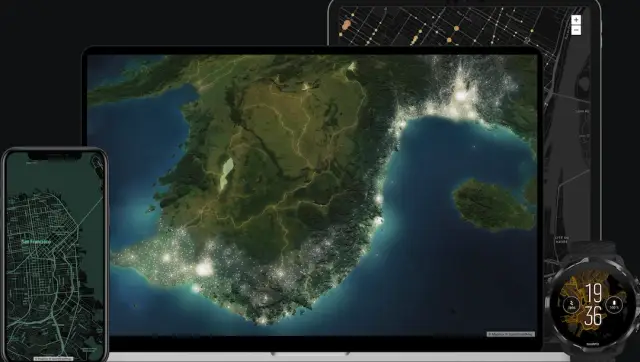
An interactive map is a dynamic, web-based representation of geographical data that enables users to engage with and explore the visualized information through various interactive features. Unlike static maps, interactive maps offer a range of customizable functionalities, such as zooming, panning, layer toggling, and displaying additional information via pop-ups or tooltips. These features allow users to analyze the underlying data more effectively, as they can access specific details and manipulate the map's view to better understand spatial relationships and patterns.
For instance, The New York Times utilized interactive mapping during the 2020 U.S. Presidential Election to display live election results, offering users the ability to drill down from national to state and county levels and observe the voting patterns in real-time. This interactive approach provided users with valuable insights into the electoral landscape and facilitated a deeper understanding of the data. According to a study by the Pew Research Center, 73% of adults in the U.S. reported using interactive maps in 2018, highlighting their growing popularity and the public's appreciation of their potential for simplifying complex data. Interactive maps have become an indispensable tool across various domains, including urban planning, environmental monitoring, transportation, and tourism, to name a few.
Interactive maps hold several advantages over traditional, static maps, making them a preferred choice for many applications. Here are some key reasons why interactive maps are considered better:
Enhanced user engagement: Interactive maps allow users to engage actively with the content, offering a more immersive and personalized experience. Users can zoom, pan, and click on specific elements to access additional information, catering to their individual interests and preferences.
Dynamic data representation: Unlike static maps, which represent data at a fixed point in time, interactive maps can display real-time or regularly updated information. This feature is particularly valuable for applications such as tracking weather patterns, monitoring traffic conditions, or visualizing social media trends.
Layered data visualization: Interactive maps enable the presentation of multiple layers of data, allowing users to toggle between them and gain a comprehensive understanding of the information. This multi-layer approach facilitates the analysis of complex data sets and the identification of relationships between different variables.
Improved accessibility: Interactive maps often come with built-in accessibility features, such as screen reader compatibility, keyboard navigation, and customizable text sizes, making them more inclusive for users with varying abilities.
Scalability and responsiveness: Interactive maps can adapt to different screen sizes and resolutions, ensuring an optimal viewing experience on various devices, such as smartphones, tablets, and desktop computers.
Easy updates and maintenance: Updating a static map usually requires redesigning and reprinting, whereas interactive maps can be easily modified and updated with new data, keeping the content fresh and relevant.
Integration with other data sources: Interactive maps can incorporate data from external sources, such as APIs or databases, to provide additional context or insights. For example, a real estate listings map can integrate with a demographics API to show the surrounding population's age distribution, income levels, or other relevant metrics.
Interactive maps offer a more versatile, engaging, and informative experience than static maps, making them a powerful tool for effectively communicating complex geographical data.
Creating an interactive map is a multi-step process that involves selecting appropriate mapping tools, preparing your data, designing the map, and incorporating interactivity.
First, decide on a suitable mapping tool or library based on your technical skill level and requirements. You might opt for GIS software like QGIS or ArcGIS, web mapping platforms such as Google Maps or Mapbox, or JavaScript libraries like Leaflet or OpenLayers. Each option caters to different levels of expertise and customization needs.
Next, gather and organize the geographic data you wish to visualize, ensuring it is in a compatible format like GeoJSON, Shapefile, or KML. Your data may include points, lines, or polygons representing various locations, routes, or areas of interest.
With your data ready, design the map using the chosen tool. Create a base map by selecting an appropriate map style or tileset, such as satellite, street, or terrain views. Then, import your data and customize the appearance of map elements using colors, icons, or patterns.
The next step is to add interactivity. Implement features like zooming, panning, and layer toggling, and enhance the user experience with pop-ups or tooltips that display additional information when users interact with map elements.
Once you've designed your map, test and refine its performance and usability across different devices and browsers. Make any necessary adjustments to ensure a seamless user experience and address any accessibility concerns.
Finally, when your map is complete, publish and share it by embedding it into your website, blog, or application using the appropriate code snippet or API integration provided by your chosen mapping tool.
Keep in mind that each tool or library has its unique workflow and capabilities, so it's important to consult the specific documentation and tutorials for the platform you select.
Interactive maps are powerful tools for visualizing and communicating complex geographic data. There is a wide array of mapping tools and platforms available to help you create custom interactive maps tailored to your needs. This article will introduce ten popular options, each with its unique features and capabilities.
Mapbox is a flexible and powerful mapping platform that allows developers to create custom maps with various interactive features. Its suite of APIs and SDKs enables the integration of maps into web and mobile applications, while its easy-to-use Mapbox Studio allows users to design unique map styles. With Mapbox, you can access a vast range of base maps, incorporate real-time data, and add custom data layers to create rich, engaging, interactive maps.
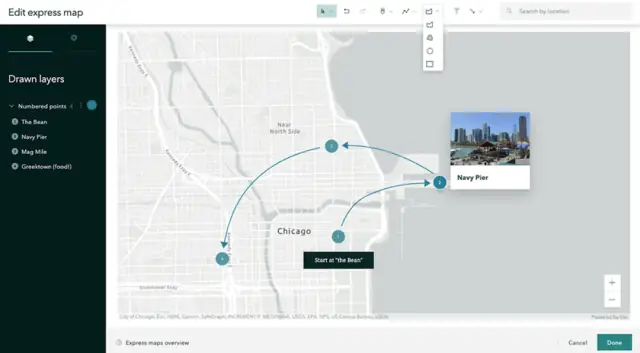
ArcGIS StoryMaps is a user-friendly web application by Esri that allows users to create immersive, multimedia-rich stories with interactive maps. Combining the power of the ArcGIS platform with an intuitive interface, StoryMaps enables the creation of compelling narratives through a combination of text, images, videos, and interactive maps. This tool is suitable for non-technical users and widely used for educational, journalistic, and public outreach purposes.
Google Maps is a widely recognized web mapping service that provides a range of APIs and tools to create custom interactive maps. Its JavaScript API enables developers to embed Google Maps into websites and applications, customize map styles, and add various interactive features. Google Maps also offers a user-friendly "My Maps" feature, allowing non-technical users to create simple interactive maps with custom markers, lines, and polygons.
StoryMapJS is a free, open-source tool developed by the Knight Lab at Northwestern University. It allows users to create interactive, multimedia-rich stories using a simple, web-based interface. Users can add a series of slides containing text, images, videos, and interactive maps, creating a narrative that guides the audience through a geospatial journey. StoryMapJS is especially suitable for journalists, educators, and storytellers who want to create immersive, map-based narratives without coding.
Visme is a versatile design platform that enables users to create engaging visual content, including interactive maps. With its user-friendly drag-and-drop interface, Visme offers a variety of customizable map templates, icons, and design elements. Although primarily a visual design tool, Visme's interactive maps feature is an excellent choice for users seeking a simple and intuitive solution for creating basic interactive maps.
Zeemaps is an easy-to-use online mapping tool that allows users to create, publish, and share custom interactive maps. With its simple interface, users can import data from various sources, such as spreadsheets, and add custom markers, lines, or polygons to the map. Zeemaps offers a range of visualization options, including heatmaps and cluster maps, making it a suitable tool for visualizing large datasets and creating engaging maps without coding.
Shorthand is a visual storytelling platform that enables users to create immersive, multimedia-rich stories with interactive maps. With its intuitive interface and a wide range of design elements, Shorthand makes it easy to create visually stunning narratives that combine text, images, videos, and interactive maps. Shorthand is particularly well-suited for journalists, content creators, and marketers looking for a tool to create engaging, shareable map-based stories.
Felt is an innovative mapping tool that focuses on creating tactile, interactive maps with a unique, hand-drawn aesthetic. Its web-based interface allows users to design and customize maps using a variety of brushes, colors, and textures. Felt also offers a range of interactive features, such as zooming, panning, and pop-ups, making it an ideal choice for artists, designers, and creatives who want to produce visually distinctive and engaging interactive maps.
Mapme is a versatile mapping platform that enables users to create custom, interactive maps without any coding. Its user-friendly interface offers a wide range of customization options, allowing users to create maps with various styles, markers, and interactive features. Mapme supports importing data from spreadsheets and offers advanced features like clustering and heatmaps, making it suitable for visualizing large datasets. Additionally, Mapme provides tools for embedding maps into websites, making it a popular choice for businesses, nonprofits, and organizations.
Scribble Maps is a straightforward online mapping tool that allows users to create and share custom interactive maps. Its intuitive interface enables users to draw directly on the map, adding markers, lines, polygons, and labels. Scribble Maps also offers features like layering, importing data from various sources, and exporting maps in different formats. With its easy-to-use tools and wide range of features, Scribble Maps is a popular choice for individuals and organizations seeking a simple solution to create interactive maps.
Numerous tools and platforms are available for creating interactive maps, each catering to different skill levels and requirements. Whether you're a developer, designer, storyteller, or simply someone who wants to create engaging visual content, these tools can help you transform your geographic data into powerful, interactive maps. Take the time to explore each option and find the one that best suits your needs and objectives.
In conclusion, the power of interactive maps to effectively communicate complex geographical data cannot be overstated. The tools and platforms highlighted in this article offer a diverse range of capabilities and cater to users with varying skill levels and requirements. From developers seeking advanced customization options to storytellers aiming to create immersive narratives, a mapping solution is tailored to every need.
As you explore these tools and embark on your journey through the world of geospatial visualization, remember that the most impactful maps present data and tell a compelling story that resonates with the audience. By leveraging the right tool for your project and combining it with thoughtful design and engaging interactivity, you can create captivating, custom interactive maps that elevate your digital content and offer a truly immersive experience.
So, go ahead and unleash your creativity, harness the power of geospatial data, and transform the way you visualize and share information with the world. Happy mapping!
Experiment with AppMaster with free plan.
When you will be ready you can choose the proper subscription.


