


Equipment reservation app: prevent conflicts and track returns
Plan an equipment reservation app that prevents double bookings, records returns and damage, and places faulty items on maintenance hold.
Delving deep into sophisticated debugging techniques, this article explores advanced strategies for x86-64 applications to help developers tackle complex software bugs.

Debugging is the meticulous process of identifying, isolating, and fixing issues within software applications. Advanced debugging goes several steps further, employing sophisticated techniques to unravel complex software problems that arise within large, intricate, or high-performance x86-64 applications. This proactive delving into the intricate web of software behavior is especially crucial when standard debugging methods fall short in diagnosing elusive bugs that manifest under very specific circumstances or are deeply rooted in system-level interactions.
A versatile arsenal of advanced debugging strategies is paramount for developers and software engineers entrenched in x86-64 architecture. This means going beyond traditional print-line debugging or IDE-based tools to harness powerful utilities such as memory analysis, automated debugging scripts, reverse engineering, and more. Having this skillset enables developers to not only fix bugs but to gain deeper insights into how their software operates under the hood — knowledge that is invaluable for both immediate issue resolution and long-term software quality enhancement.
Advanced debugging also incorporates a mindset of relentless curiosity and analytical thinking. Debuggers must navigate through assembly-level code, untangle complex thread interactions, and dissect performance bottlenecks with the precision that demands patience and expertise. While the journey of mastering advanced debugging teeters on the brink of art and science, it promises developers the capabilities to tackle the most obstinate of bugs with confidence and improve the resilience and reliability of their software on the powerful x86-64 platform.
In the upcoming sections, we will dive into the nitty-gritty of these advanced techniques, presenting hands-on knowledge curated for the developers' journey toward becoming a maestro of debugging. Each strategy and tool discussed will be valuable to your toolbox, expanding your capabilities and elevating your craft in x86-64 application development.
Comprehending the hardware's intricacies is invaluable for debugging applications, especially on the x86-64 architecture. The x86-64, also known as AMD64 or Intel 64, is a 64-bit version of the x86 instruction set, and it introduces several enhancements over its 32-bit predecessor, which can reveal and obscure bugs in software applications.
First and foremost, the x86-64 architecture allows access to a much larger address space, which means developers can work with extensive amounts of memory — up to 16 exabytes in theory. While this capacity is beneficial for large applications, it also means that pointers are expanded from 32 bits to 64 bits, potentially introducing new class of bugs related to pointer arithmetic and memory addressing. Debugging software on x86-64, therefore, requires vigilance for errors that could manifest from incorrect assumptions about memory addressing, or the misuse of pointer types.
The x86-64 architecture also incorporates additional general-purpose registers and new instructions, which can optimize performance and create new avenues for bugs. In a debugging context, understanding how an application uses these registers during execution is critical. Registers may contain critical values that, if mismanaged, could lead to segmentation faults and other subtler critical issues than in 32-bit environments. A debugger that can clearly display the state of these registers and track their usage over the execution of an application is therefore indispensable.
Another aspect to consider is the calling convention which is different in x86-64 when compared to its predecessors. In x86-64, the first few function arguments aren't passed on the stack as they were traditionally in 32-bit x86, but in registers. Knowing which registers to check when you're debugging and looking to understand a function's parameters is essential. A misinterpretation of the calling convention could lead to erroneous conclusions about function execution and the origins of bugs.
SIMD (Single Instruction, Multiple Data) instructions, which can process multiple data points with a single instruction, are also expanded in the x86-64 architecture. Debuggers must be able to interpret the state of the SIMD registers and the results of SIMD instructions to provide a clear picture of how an application processes data in parallel. Incorrect use of these instructions could easily result in bugs that produce incorrect outputs or cause crashes.
Considering these intricacies, x86-64 debugging is often about understanding the subtle interactions between hardware capabilities and software logic. In many scenarios, bugs can arise from a developer's incorrect assumptions about how their code will execute on the hardware. Tools that can simulate the execution of code and predict its behavior on the CPU core, showing the changing state of registers and memory, become vital components of the debugging toolkit.
For developers working on the AppMaster platform, an understanding of x86-64 is not as critical, since the platform handles the underlying architecture complexities. Nevertheless, in-depth knowledge can empower developers to better leverage the platform's capabilities and to understand the performed operations at a lower level if needed.

Embarking on a journey to debug x86-64 applications begins with erecting a solid foundation: a powerful debugging environment. Even seasoned developers can find themselves lost in the complex web of software issues without this critical setup. The ideal environment not only equips you with the right widgets and gadgets but streamlines your process and brings forth clarity in diagnosing your code. Here's how to sculpt an effective debugging crucible for your x86-64 endeavors:
The debugger is the linchpin of your debugging toolkit. For x86-64 applications, popular debuggers like GDB (GNU Debugger) are commonly utilized for their extensive feature set and flexibility. Others might opt for LLDB, part of the LLVM project, known for its modern design and integration with tools like the Clang compiler. When selecting a debugger, assure it supports all facets of the x86-64 architecture, from SSE vector instructions to hardware exception handling.
An Integrated Development Environment (IDE) can simplify the debugging process by combining code editing, building, and debugging in one interface. Visual Studio or JetBrains Rider, replete with their intelligence and intuitive interfaces, are the go-to choices for some. They offer seamless debugger integration and present a visual approach to setting breakpoints, stepping through code, and inspecting variables.
For the old-school soul who prefers a hands-on approach, mastering console commands in debuggers like GDB unpacks a deeper understanding of the program's execution and can be more flexible in complex scenarios. A console setup benefits significantly from custom scripts and aliases to automate frequent tasks and checks.
A keen eye on system-level events can unravel issues beyond the direct reach of the debugger. Therefore, incorporating system monitoring tools and accessing logs are crucial. dmesg, journalctl, or platform-specific monitoring utilities can provide insights into kernel-level events that might be affecting your application's behavior.
Issues in x86-64 applications are not always about crashes or incorrect behavior. Performance bottlenecks can be just as critical, especially for applications executing intensive computational tasks. Thus, include performance profiling tools such as perf, Valgrind, or Intel VTune Profiler in your debugging suite to detect and rectify efficiency issues.
Bugs can creep in with each new commit, and having a version control system is imperative for tracking changes and correlating them with new issues. Services like git can work alongside debugging tools to pinpoint when and where bugs were introduced.
Amidst the labyrinth of code debugging, no-code solutions like AppMaster can provide an oasis of simplicity. With its visual representation of data flows and business logic, AppMaster can lessen the need for granular code debugging and, in certain scenarios, prevent bugs from arising in the initial stages of development.
Developers can deftly navigate the entanglements of x86-64 application debugging confidently through a judicially designed debugging environment. The above-mentioned tools and practices are but a starting point, and the wisdom lies in continuously enhancing and personalizing this environment to best match the demands of your projects and the nuances of the x86-64 architecture.
Debugging complex x86-64 applications requires a thorough understanding of the code and an intuitive mastery over the debugging tools at your disposal. Among these, breakpoints and watchpoints stand out as some of the most potent features of modern debuggers. They allow you to halt program execution under specific conditions, examining the state of the application and the values of variables in real-time.
Breakpoints are traditionally placed at certain lines of code or addresses in the executable, where developers suspect bugs or require inspection. Yet, advanced usage involves more than just pausing the execution. Conditional breakpoints are a step up, pausing the application only when certain conditions are met, minimizing the time spent sifting through irrelevant data. For example, setting a conditional breakpoint to activate when a variable reaches a specific value can pin down the exact moment an anomalous behavior occurs, which is immensely beneficial for identifying edge-cases resulting in crashes or logical errors.
Another advanced technique is to employ breakpoints that execute actions such as logging data to a console or file without stopping the application. This technique can gather information across multiple runs of a program or during long-term execution scenarios. It's particularly useful for identifying and resolving issues that manifest over time or under specific usage patterns that are not easily replicated in a conventional debugging session.
Watchpoints, also known as data breakpoints, are another powerful feature for debugging x86-64 applications. They can alert the developer when the content of a specified memory location changes. This is essential to catch the exact moment when a variable is assigned an incorrect value. Watchpoints can be the key to unlocking the mystery if you're investigating a heap corruption or a similar memory-related issue. When you're dealing with large, performance-sensitive applications, it's important that while some debuggers may slow the program significantly when using watchpoints, hardware-assisted watchpoints can perform the same task with much less overhead.
To leverage breakpoints and watchpoints to their fullest potential, it's vital to have a strategic approach. Integrate them into the debugging process by choosing the right moments and conditions for activation, which can often reveal the deeper issues affecting the application. With intuition, experience, and these advanced debugging techniques, you can tackle the most elusive and complex bugs that x86-64 applications might harbor.
When it comes to advanced debugging, particularly for x86-64 applications, two of the most powerful allies for a developer are disassemblers and decompilers. These tools are essential for digging into the binary executables when source code debugging isn't enough or when dealing with optimized or obfuscated code that behaves unpredictably.
A disassembler is a tool that translates machine code — the raw binary instructions that the CPU executes — back into assembly language. This process allows developers to see a textual representation of the instructions their program is running, which is crucial when trying to understand low-level issues such as memory corruption, unexpected CPU instructions execution, or security vulnerabilities exploitation.
Using a disassembler, developers can:
Decompilers go a step further by attempting to reverse the compilation process, transforming machine code back into a higher-level language code, such as C or C++. It's not always a perfect process, and the resultant code may not be as readable or maintainable as the original source. Still, it provides invaluable insights into what the application is doing at a conceptual level.
A decompiler enables developers to:
When using disassemblers and decompilers, it's important to consider several factors to get the most out of them:
When working with a no-code platform like AppMaster, you typically don't need to interact with disassemblers or decompilers as the platform manages the code generation and execution for you. Still, understanding how these tools work can be beneficial for debugging more complex issues, even within a no-code environment or when integrating the no-code platform with other existing systems.
Whether you're maintaining legacy systems, analyzing crashes in optimized builds, or just satisfying curiosity about the inner workings of your binaries, disassemblers and decompilers are indispensable tools in the advanced debugger's toolkit.
Memory analysis is a critical component of the debugging toolkit, particularly for complex applications operating on the x86-64 architecture. Sophisticated applications often deal with large datasets, dynamic allocation, and concurrent execution threads, creating plenty of room for subtle and difficult-to-track memory issues. Here's how memory analysis can be leveraged effectively to detect and resolve these elusive bugs.
Before delving into memory analysis techniques, grasping how memory is structured and utilized by x86-64 applications is essential. The x86-64 architecture supports a 64-bit virtual address space, which allows applications to use a vast amount of memory. Yet, with this vast space comes the complexity of effectively managing it — issues like buffer overflows, dangling pointers, memory leaks, and other types of corruption can be far more insidious and have broader implications than in more constrained environments.
There are several tools at a developer's disposal to analyze memory usage:
Each tool can be deployed to identify specific types of memory issues. For example, Valgrind is excellent for detecting leaks and undefined memory usage, while AddressSanitizer can quickly pinpoint buffer overflows and similar access errors.
When using memory analysis tools, consider the following strategies:
As a former software developer, I can attest to the importance of routinely analyzing memory—especially in multi-threaded environments where the interplay between threads can lead to complex synchronization issues and race conditions.
No-code platforms like AppMaster also address some aspects of memory-related bugs by abstracting the underlying memory management to a certain extent. They provide a layer of error-checking and automated testing that can preemptively resolve some standard memory issues. Still, direct memory analysis remains an essential skill in a developer's arsenal for low-level debugging and performance optimization.
Remembering that memory analysis is not a one-time activity but a continuous process throughout the application's lifecycle is important. Regularly incorporating these techniques ensures that applications remain performant, reliable, and secure, effectively managing the generous but complex memory space the x86-64 architecture provides.
Performance profiling is a crucial step in optimizing x86-64 applications, as it helps identify parts of the software that may not be functioning as efficiently as possible. Profiling goes hand-in-hand with debugging, as it can unveil not only inefficiencies but also latent bugs contributing to those performance issues.
To begin profiling, developers must first choose the appropriate tools. There are various profiling tools available that are designed specifically for x86-64 applications, such as gprof, Valgrind's suite of tools, and Intel's VTune Amplifier. Each of these tools has its own strengths and application areas, from high-level overviews of execution time across functions to in-depth analyses of cache hits and misses.
Once a tool is selected, the next step involves running the application in profiling mode. During this phase, the profiler will collect data on different aspects of the application's performance, such as CPU cycles consumed, memory access patterns, and system calls made. Some profilers offer the capability to trace the application's execution in real time, providing immediate feedback on the impact of any changes you make.
A critical aspect of profiling is identifying hotspots, the sections of code that consume the most resources. Hotspots are often the result of inefficient algorithms, unnecessary data processing, or poor memory management. By refocusing optimization efforts on these hotspots, developers can achieve significant performance improvements with less effort.
Developers can dive into the profiler's call graphs for a more granular analysis to understand the relationships and dependencies between different functions and modules. These call graphs help to pinpoint indirect sources of performance issues where the solution may involve refactoring or redesigning certain parts of the code.
One of the main challenges in profiling is dealing with the vast amount of data generated. Effective profiling requires a methodical approach, often starting with a broad overview and iteratively zooming into specific areas. Furthermore, correlating profiling data with source code is essential to make meaningful improvements. Modern profilers integrate with IDEs to help navigate directly from profiling outputs to the corresponding code lines.
After identifying performance bottlenecks, developers can take various actions, like optimizing algorithms, improving data structures, reducing I/O operations, or leveraging parallel programming techniques. In multi-threaded applications, profiling can also help detect and resolve synchronization issues that lead to deadlocks or race conditions.
In the context of no-code platforms, such as AppMaster, the general profiling principles still apply. AppMaster provides a visual layer that abstracts the underlying code, which can be instrumental in pinpointing areas where performance could be improved — especially when dealing with web and mobile applications that may involve complex interactions such as API calls or database queries.
Finally, profiling should not be a one-time event but part of an ongoing maintenance process. As applications and their workloads evolve, new bottlenecks might manifest, requiring another profiling session. Continuous profiling and optimization become even more critical in a scaled environment where performance directly correlates with user experience and operational costs.
Profiling is an art that entails technical capability and a strategic approach to unravel the intricate tapestry of software performance. With the right toolkit and a sound methodology, profiling can transform a sluggish application into one that responds briskly to user interactions and operates efficiently.
Automating parts of the debugging process can drastically reduce the time developers spend on finding and fixing issues, especially in complex x86-64 applications. Debugging scripts can automatically execute series of commands, analyze outputs, and handle routine checks so that you can focus your energy on more sophisticated problems. Let's explore how you can implement automated debugging with scripts and integrate this technique into your workflow.
Firstly, consider what repetitive tasks you perform during debugging sessions: setting breakpoints, stepping through code, inspecting variables, etc. These can often be scriptable actions. For example, suppose you frequently check certain conditions or variables at specific points in the code. In that case, a script can be used to automatically break execution and log the relevant information for you to review later.
Creating a custom debugging script starts with defining the scope of your goal. Think about the common bugs that occur and how you generally detect them. Most debugging tools that support x86-64 applications (such as GDB or WinDbg) have scripting capabilities, utilizing Python, Lua, or their proprietary scripting languages. You can write scripts to:
By scripting these actions, you can run them as a batch process, perform them at scale, or even schedule them to run at specific times.
In the era of continuous integration and delivery, debugging scripts play a vital role in the automated pipeline. They can be set to run after each commit or build to catch regressions or new bugs as soon as they are introduced. These scripts can be integrated into CI tools like Jenkins, CircleCI, or GitHub Actions, which can then notify developers immediately if a problem is detected.
Your scripts shouldn’t just perform actions; they should also provide insight. Outputting formatted logs, creating bug reports, or even visual graphs of performance metrics can turn raw data into actionable knowledge. Consider tools that digest log files and present high-level summaries of the application’s health or performance over time.
No-code solutions like AppMaster are gaining popularity for their ability to automate and streamline workflows. Although primed for application development, their principles can extend to debugging by using visual programming to define how automated scripts should work. For instance, you could set up a system where triggers in a no-code platform execute debugging scripts and process the results, simplifying the oversight process.
Deploying scripts necessitates understanding when and how they should be used. Overreliance on automation can lead to a false sense of security, and not every situation can be scripted. Skilled developers know to balance automated scripts with hands-on debugging to address the unique challenges presented by their x86-64 applications.
When implementing automated debugging with scripts, it's vital to adhere to best practices:
Implementing automated debugging in x86-64 applications not only saves time but also brings a level of precision and repeatability to an otherwise manual process. By leveraging scripts, integrating them into CI/CD pipelines, and supporting your debugging efforts with sophisticated toolsets like AppMaster, you are positioning yourself to tackle bugs more efficiently and effectively than ever before.
Reverse engineering is a powerful technique often associated with understanding proprietary systems or enhancing security protocols. It's also an immensely valuable tool for developers when debugging complex x86-64 applications. By breaking down software into its constituent parts, reverse engineering allows developers to gain insights into both the behavior and structure of an application under the hood.
Reverse engineering can be particularly effective when source code isn't accessible or when dealing with legacy systems. In these cases, tools such as disassemblers are used to convert binary code into a more human-readable form — assembly language. With the context of x86-64 architecture, this translated code provides clues to application logic, memory usage, and even potential security flaws.
Understanding assembly is essential for developers working with x86-64 architecture as it directly maps to how the processor executes instructions. This awareness enables them to pinpoint problematic code sequences and reason about unexpected behaviors in a way high-level debugging alone cannot achieve. Moreover, reverse engineering paired with dynamic analysis tools such as debuggers can reveal runtime issues like race conditions and deadlocks that disrupt the proper flow of a multi-threaded application.
Another aspect is the use of decompilers that attempt to translate the low-level assembly back to a higher-level language. While decompiled code may not always be perfect, it provides a platform for developers to hypothesize about the potential cause of a bug and validate their assumptions through further targeted debugging.
Moreover, in the context of security, reverse engineering is indispensable. Developers can simulate a hacker's approach to uncover vulnerabilities within the application, like buffer overflows or improper encryption. This preemptive strike can save time in debugging and enhance the security and integrity of the application.
Including reverse engineering in the debugging arsenal adds depth to a developer's understanding of both the application and the architecture it runs on. As a supplement to traditional debugging techniques, it can often be the key to uncovering elusive bugs that standard methods might overlook.
Even platforms like AppMaster, with their no-code focus, acknowledge the complexity behind application development. They aim to simplify this complexity by abstracting it away, yet for those delving into the internals of x86-64 applications, reverse engineering remains an invaluable skill in pinpointing and fixing those deep-seated issues.
An effective debugging strategy integrates advanced tools that track down bugs and enhance productivity and code quality. As applications grow in complexity, especially on the x86-64 architecture, developers require a sophisticated toolkit to handle the intricate debugging tasks that come their way. By embedding these advanced tools into their daily workflow, developers can create a debugging process that precisely targets specific issues.
One such tool that often becomes indispensable is a powerful Integrated Development Environment (IDE) that supports the x86-64 architecture. IDEs today often come with in-built debugging capabilities that offer seamless transitions between writing, testing, and debugging code. Features such as intelligent code completion, code navigation, and automated refactoring can considerably reduce the time spent on fixing bugs.
Employing memory profilers like Valgrind can be a game-changer for memory-related issues, which are often tough to trace. Such profilers detect memory leaks, buffer overflows, and other memory mismanagement issues that may not present immediate symptoms but can lead to significant problems down the line.
Another layer of advanced tooling lies with static analysis tools, which examine code without executing it. These tools can catch potential errors and vulnerabilities early on, by enforcing coding standards and identifying anti-patterns. Static analyzers can be run automatically as part of a Continuous Integration (CI) workflow, thus ensuring bugs are caught before they enter production.
Symbolic debuggers like GDB (GNU Debugger) provide a window into the program execution at the lowest level. Advanced use of GDB includes setting conditional breakpoints, examining the call stack, watching variables, and even altering the execution state, which can be particularly beneficial when debugging complex x86-64 software issues.
When debugging applications that interface with hardware, or when simulating certain conditions is necessary, hardware emulators or simulators come into play. These tools offer a controlled environment where the x86-64 application can be run, and different hardware scenarios can be tested without actual physical hardware.
For developers dealing with compiled binaries, reverse engineering tools and disassemblers such as IDA Pro or Ghidra are essential. They allow you to unpack the application at the binary level, providing insights into the inner workings of programs when the source code isn't available, or when dealing with obfuscated or third-party code.
In the context of no-code platforms, such as AppMaster, the ability to understand and resolve issues can be built-in through visual debugging tools that display the flow of executions and data within the app. These platforms can automatically handle lower-level details and yet provide options for logging or debugging when needed, making the debugging process more accessible to designers and developers who may not be as familiar with x86-64 specific details.
Advanced debugging also entails specialized network and API debugging tools, such as Wireshark for network traffic analysis and Postman for testing API endpoints. They can track down bugs manifesting during client-server interactions and can be particularly elusive during conventional debugging sessions.
The key to successfully integrating advanced tools is their seamless insertion into the developer's workflow. This requires a proper understanding of the tools and a culture that encourages constant learning and sharing of best practices. Regularly reviewing and updating the toolset to the latest versions ensures that developers continually leverage state-of-the-art functionalities provided by these tools.
The goal of integrating advanced debugging tools in the workflow is not just to fix current bugs, but to prevent future issues from arising. By incorporating these tools thoughtfully, developers can maintain a high standard of software quality, reduce downtime, and consistently improve the user experience of their x86-64 applications.
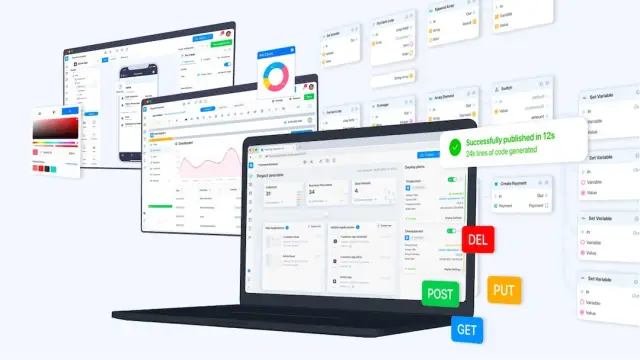
In an era where efficiency and rapid development are paramount, no-code platforms have carved out a significant niche in the tech industry. Among their many virtues, these platforms offer simplified debugging experiences that can transform the process for developers and non-developers alike. Let's delve into how no-code platforms like AppMaster play a crucial role in easing the debugging of applications, even those running on complex x86-64 architectures.
First and foremost, no-code environments standardize many aspects of the software development process. By providing a visual approach to application development, these platforms inherently reduce the potential for human error that can lead to bugs. When developers work with a conventional codebase, especially on the x86-64 architecture with its intricate instruction set and memory management, they can inadvertently introduce errors that are hard to trace. No-code platforms eliminate this by abstracting the underlying code, allowing for a cleaner and more predictable application behavior that simplifies debugging.
AppMaster, for example, allows developers to visually create data models and business logic through its Business Processes (BP) Designer. Such an approach means you're less likely to encounter unexpected behavior arising from syntax errors or typing mistakes, which are common stumbling blocks in traditional coding. If there's an issue, it is often more apparent and localized within the visual flow, enabling quicker identification and rectification.
No-code platforms can also assist in debugging through powerful logging systems and visual cues that represent the flow of data and logic in real-time. Developers can watch live data passing through the process steps and identify the exact point at which things go awry. In addition, many such platforms offer simulation modes, where you can replicate the logic flow and input data without impacting the live environment, which can be incredibly valuable for isolating and resolving bugs.
In x86-64 applications where performance and optimization are critical, no-code platforms provide profiling tools that identify application performance bottlenecks. While it may not replace detailed profiling at the architecture level, it presents a higher-level overview that is useful for rapid diagnosis and allows developers to focus on optimizing the parts of the application that will have the highest impact on performance.
Another aspect where AppMaster and similar platforms shine is in their ability to integrate with existing diagnostic tools. Developers don't lose out on the benefits of traditional debugging tools; they can use them with the no-code platform's capabilities to achieve a more thorough and less time-consuming debugging process. For instance, AppMaster generates Swagger (OpenAPI) documentation for server endpoints, making inspecting and debugging API-related issues easier.
Generating executable binary files or source code by no-code platforms does not exclude the traditional debugging practices. With AppMaster, for example, developers can obtain the source code for on-premises hosting, giving the flexibility to apply x86-64 specific debugging techniques and tools directly to the generated code if necessary.
To wrap it up, the role of no-code platforms in debugging is multifaceted. They minimize the chance of bugs slipping into the application through automation and standardization, while still providing visibility and control where needed. Their visual nature and integration capabilities make them a powerful ally in the debugging toolkit, even for applications that eventually run on complex x86-64 systems.
Multi-threading introduces complexity but provides vast performance benefits, especially on x86-64 architectures known for their concurrency capabilities. Debugging multi-threaded applications requires a methodical approach and specialized techniques to root out concurrency issues such as race conditions, deadlocks, and thread starvation. This section articulates strategies and best practices for diagnosing and resolving threading issues in x86-64 applications.
Each thread in a multi-threaded application operates in its own execution context but shares the process's resources. A strong grasp of context switches, how the CPU handles multiple threads, and the impact of this upon your x86-64 application's execution is fundamental to successful debugging. Developers should be able to answer critical questions such as which thread owns a particular mutex or is waiting on a condition variable at any given time.
Conventional breakpoints can halt the entire application, but developers often need to pause specific threads or monitor conditions across threads when debugging multi-threaded code. In such cases, use thread-specific breakpoints that only pause execution when the related thread hits them. Similarly, watchpoints can be set to alert developers when a particular piece of data is read or written, which is incredibly useful in tracking down data races and unintended data access across threads.
To combat concurrency issues in x86-64 applications, logging using synchronization primitives like mutexes, semaphores, and condition variables can provide insight. If a deadlock occurs, these logs can help trace back to the point where threads may have become entangled. Furthermore, employing sophisticated lock analysis tools and thread analyzers can shed light on possible deadlocks or contention points that are more challenging to spot through manual inspection.
One advanced debugging technique involves simulating specific thread scheduling scenarios to reproduce race conditions or deadlocks reliably. Setting thread priorities, manually pausing and resuming threads, and manipulating the order of events can create the conditions necessary for thoroughly examining concurrency bugs. Automated test suites that can simulate these scenarios can be exceptionally effective in detecting and resolving complex threading issues.
Visual tools that represent threading activity can help build a clearer picture of how threads are interacting. These tools can present execution timelines, resource allocation graphs, and other visual aids to make it easier to understand where problems occur. Some Integrated Development Environments (IDEs) offer sophisticated visualization of thread activity, helping developers better reason about multi-threaded execution and identify issues quickly.
Conditional synchronization features can aid developers in setting up scenarios where certain conditions have to be met for a bug to manifest. This can include advanced conditional breakpoints that combine thread state with data conditions. For example, a breakpoint could be specific to when a particular variable reaches a certain value in the context of a given thread.
Thread sanitizers are powerful tools that modern compilers and platforms provide to help detect race conditions and other concurrency-related issues at runtime. When compiling applications for debugging, ensure that thread sanitizers or dynamic analysis tools are enabled. These tools can often catch subtle threading issues that may go unnoticed during regular debugging sessions.
While our focus here is on the intricacies of x86-64 multi-threaded debugging, we must not overlook the potential of no-code platforms in simplifying the initial stages of an application’s development lifecycle, including debugging. Platforms like AppMaster abstract away some of the complexities associated with multithreading, thus reducing the initial debugging overhead. Yet, when the complexity scales or when the application demands intricate thread management, developers need to revert to hands-on debugging techniques, as outlined in this section.
By combining a deep understanding of the x86-64 architecture and its threading model, with the practical application of advanced debugging techniques and tools, developers can dive into the sophisticated realm of multi-threaded applications. It is a challenging but rewarding aspect of software development, where efficiency improvements can significantly impact the application's performance and reliability.
Debugging x86-64 applications is a critical skill that requires precision, patience, and a deep understanding of both software and system architecture. While many advanced tools and techniques can aid in this process, it's also easy to fall into common traps that can hinder your progress, leading to frustration and wasted time. Identifying these pitfalls early and learning how to avoid them can enhance your debugging practices and make you a far more effective developer.
One of the first significant pitfalls is the overreliance on automated tools. While these are indispensable in handling repetitive tasks, blindly trusting them without understanding what they are doing can lead you astray. It's important to remember that tools are just aids; they cannot replace a developer's critical thinking and problem-solving skills. Make sure to understand the output of automated tools and, if something doesn't seem right, take a step back and consider the results manually.
Another issue that often arises is the misinterpretation of debugging data. Especially in x86-64 architectures, where multiple layers of abstraction exist, it's easy to misread the signs that a debugger is giving you. Maybe the bug manifests due to a quirk in the processor's pipeline or a peculiarity of the operating system's memory management. Always ensure you comprehend the context within which your application operates and be ready to dive into system-level details if needed.
The neglect of architecture-specific features can also lead to misdirection. x86-64 applications can behave differently depending on whether they are running on a virtual machine, utilizing specific CPU extensions, or interacting with hardware in unusual ways. Ignoring these aspects and not tailoring your debug strategy can result in chasing down errors that are not the root cause. To mitigate this, keep your knowledge of the hardware updated and factor in its characteristics when debugging.
Sometimes, the problem lies in insufficient logging. Without enough detailed logs, reproducing and diagnosing the issue can be near impossible, particularly if the bug is infrequent or occurs under specific, hard-to-replicate conditions. Increase the verbosity of the logs where it seems relevant, and don't hesitate to add more logging before starting a debug session.
The fixation on a supposed cause of the bug, also known as confirmation bias, is another trap. It's crucial to maintain an open mind and not to get too attached to your first hypothesis. If the evidence doesn't support your theory, be prepared to discard it and search for alternative explanations.
A common pitfall when dealing with multi-threaded programs is the failure to consider timing and synchronization issues, such as race conditions or deadlocks. These bugs can be intermittent and challenging to replicate. To catch them, use thread analysis tools and review your code for proper use of synchronization primitives. Moreover, implementing unit and integration tests with a specific focus on concurrency can greatly reduce the occurrence of these errors.
A particularly vexing issue in advanced debugging is getting lost in the weeds. You might lose track of the bigger picture when you find yourself deep inside a stack trace or stepping through assembly instructions. To prevent this, periodically remind yourself of the end goal, or pair with another developer who can offer a fresh perspective.
Last but not least, one should be wary of the misuse of optimization flags during compilation. These flags can sometimes cause code to behave differently or obscure the source of bugs due to inlining, code rearrangement, or eliminating unused variables. When debugging, it might be helpful to recompile your application with optimization turned off, or at specific levels that make the erratic behavior more apparent.
Advanced debugging of x86-64 applications is an art as much as it is a science. By acknowledging and avoiding these common pitfalls, developers can sharpen their skills and become more adept at diagnosing and resolving complex software issues.
Advancing to the level of a 'debugging maestro' requires a blend of knowledge, practice, and creativity. Sometimes bugs in x86-64 applications may feel insurmountable, but with the right mindset and advanced techniques, virtually all problems can be untangled. An expert debugger knows their tools intimately and understands the importance of a systematic approach to diagnosing and resolving issues.
As you accumulate experiences with various debugging scenarios, each challenge refines your skills and often teaches you something new about the architecture, the application, or even the programming language at hand. You'll learn the ins and outs of the x86-64 application environment, from memory management nuances to multi-threading complexities, and every bug squashed adds to your expertise.
Remember, becoming proficient in debugging is a continuous journey. Technologies are perpetually evolving, and so must your debugging techniques and toolsets. Whether you're employing reverse engineering to gain insights into third-party code or scripting out routine checks to save time, it's your persistence and passion for delving into the rabbit hole of intricate bugs that make you a master of the craft.
Equally important is acknowledging the shift in how applications are developed. It's not just about individual prowess in traditional coding anymore. Modern development ecosystems, like AppMaster's no-code platform, simplify many application development and debugging aspects. They allow you to focus on the big picture while handling the underlying code-generation, presenting a new frontier for problem-solving that harnesses the power of visual programming and automation. If you haven't yet, exploring the possibilities offered by such platforms may very well be your next step towards becoming an all-rounded debugging maestro.
Embrace the complexity, cherish the learning moments, and keep sharpening your debugger's toolkit. Remember, every challenge is an opportunity to perform a little magic, turning the seemingly impossible into a testament of your problem-solving prowess.
Advanced debugging techniques include using breakpoints and watchpoints, disassemblers, memory analyzers, performance profilers, automated scripting for debugging, and reverse engineering. Properly understanding and using these tools can significantly improve the debugging process for x86-64 applications.
Understanding x86-64 architecture provides insights into how applications execute on the processor, allowing you to optimize the debugging process by tailoring techniques to suit specific architectural features such as its registers, instruction set, and memory model.
A well-configured debugging environment gives developers the control and visibility needed to diagnose and fix bugs efficiently. It includes a powerful debugger, access to logs, and other integrated development tools.
No-code platforms like AppMaster can simplify the debugging process by automating certain aspects and visualizing the flow of the program, making it easier to identify and solve issues without deep diving into code.
Automated debugging scripts can speed up the debugging process, by repetitively testing and diagnosing common issues, allowing developers to focus on more complex bugs that require creative problem-solving.
Memory analysis helps identify bugs tied to memory management, such as leaks, corruption, or incorrect allocation, which are particularly tricky in complex x86-64 applications.
Common pitfalls include overlooking architecture-specific details, ignoring subtle memory corruption issues, under-utilizing available tools, and not automating repetitive debugging tasks.
Profiling enables developers to understand the performance characteristics of their applications, which can uncover hidden bugs and bottlenecks that don't necessarily cause crashes but degrade the overall performance.
Reverse engineering is the process of deconstructing software to understand its components and operation. In debugging, it can be used to analyze software for which the source code is not available or to understand complex code paths at a deep level.
Intelligent use of breakpoints and watchpoints includes conditional breaking, logging without halting, and using hardware-assisted watchpoints to monitor data without significant performance impacts.
Disassemblers and decompilers are tools that translate machine code back into a higher-level representation. They can be invaluable in understanding what the CPU is executing, especially when dealing with crashes or security vulnerabilities.
Yes, debugging multi-threaded applications can benefit from specific strategies such as using thread-safe breakpoints, analyzing thread interactions, and ensuring proper synchronization mechanisms to avoid concurrency-related bugs.
Experiment with AppMaster with free plan.
When you will be ready you can choose the proper subscription.


