


Equipment reservation app: prevent conflicts and track returns
Plan an equipment reservation app that prevents double bookings, records returns and damage, and places faulty items on maintenance hold.
Discover how the Zap Logger tool enhances the logging capabilities of your Go applications, ensuring fast, structured, and customizable logging to fit your needs.

When developing efficient applications in Go, one of the essential aspects that developers focus on is logging. Logging not only aids in monitoring applications and diagnosing issues but also provides valuable insights into system behavior and performance metrics. Given its immense importance, the choice of logging library can significantly influence an application's performance and maintainability. That's where Zap Logger, a Go logging library, steps in to change the game for developers by offering a versatile and efficient solution.
Zap Logger is acclaimed for its blazing fast and structured logging, providing superior performance while generating rich, structured logs. Structured logs are a boon for modern applications, especially when you have to sift through mountains of log data to pinpoint an issue. With its focus on speed and low overhead, Zap Logger ensures that your application's logging does not become a bottleneck, even under high load. The library stands out due to its developer-friendly features that allow for quick and effective customization, ensuring that logs convey the exact information required in the most accessible format.
In simple terms, Zap Logger is designed to be lightning-fast, allowing developers to log millions of lines per second without significantly impacting the application’s performance. This characteristic is particularly beneficial for high-load systems where logging could otherwise result in performance degradation. Moreover, its API provides different logging levels and allows for easy integration within existing Go projects, making Zap Logger a preferred choice for both new and seasoned Go developers.
The utility of structured logging provided by Zap Logger cannot be overstated. It organizes log output into a consistent, machine-readable format such as JSON, making log data easily queryable and extremely friendly for various logging tools and services. For developers seeking to optimize their applications, this means enhanced ability for log analysis, quicker debugging, and streamlined issue resolution.
Perhaps you're developing a complex cloud application or a microservices architecture, where understanding the interactions and transactions at a granular level is critical for maintaining service health. This is where Zap Logger can provide immense value, saving time and effort with its high-performance logging capabilities. Moreover, as an author with a background of 20 years in software development, I appreciate how tools like Zap Logger represent a leap forward in development efficiency and application observability.
While the article explores Zap Logger in more depth, it's noteworthy that tools like AppMaster, a no-code platform, often incorporate similar high-efficiency practices in their design. Such platforms enable rapid development without compromising the quality and scalability of the applications, with logging systems being a core part of this ecosystem. As you navigate through the features and benefits of Zap Logger, consider how this tool can elevate the logging practice within your Go applications to a new level of excellence.
Zap Logger is a high-performance logging library specifically designed for Go applications, which stands out for its speed and structured logging. It brings several features that make it a preferred choice for developers looking to implement efficient and reliable logging without compromising the speed and overhead of their Go applications. Here are some key features of Zap Logger and the benefits they offer:
These features contribute to Zap's utility as a logging tool, enabling Go developers to create a more maintainable, transparent, and high-performing application logging system. For those looking at the full development stack, repositories like AppMaster thrive by integrating such performant tools within their own logging mechanisms, offering comprehensive solutions from backend to frontend including effective logging strategies. With Zap Logger, you're enhancing your application's logging capabilities and simplifying the log analysis and maintenance process.
Logging is a fundamental aspect of any application's operations. It helps debug, monitor the system’s health, and provide insights into application behavior. In Go applications, Zap Logger stands out as a performant library which handles logging efficiently and seamlessly integrates into your project. Here's a guide to installing and integrating Zap Logger in your Go applications.
Firstly, you'll need an existing Go environment setup to incorporate Zap Logger into your project. Assuming you have that covered, installation is fairly straightforward. You execute the installation command:
go get -u go.uber.org/zap
This command retrieves the Zap Logger package and its dependencies and places them in your Go workspace. Once you have the Zap Logger installed, it's time to integrate it into your code.
Begin by importing the necessary Zap packages at the beginning of your Go files:
import ( "go.uber.org/zap" "go.uber.org/zap/zapcore" )
Next, set up a basic logger using Zap's presets which provide reasonable defaults for most use cases:
logger, _ := zap.NewProduction()
This constructs a new logger with default configurations suitable for production environments. For development environments, you might want to use a more verbose logger:
logger, _ := zap.NewDevelopment()
Both NewProduction() and NewDevelopment() create loggers that are ready to use without further adjustments. These default loggers include features like structured logging and leveled logging.
After creating the logger, you can immediately start using it in your application:
logger.Info("Zap Logger integrated successfully!", zap.String("environment", "production"), zap.Int("attempt", 1), zap.Duration("backoff", time.Second), )
Zap Logger allows you to log with different levels of severity, ranging from debug logs with logger.Debug() for detailed information valuable during the development phase, through to critical errors with logger.Fatal(), which logs the message and then calls os.Exit(1).
It is a good habit to defer the syncing of the logger to ensure all buffered logs are flushed:
defer logger.Sync()
Keep in mind that logger.Sync() is especially important for asynchronous loggers or when your application might terminate abruptly. Wrapping up the integration, you simply replace instances where you'd normally use Go's default log package with the corresponding calls to your Zap logger instance.
Installing and setting up Zap Logger in your Go projects markedly uplifts your logging mechanism, providing a rich set of features without compromising on performance. For more advanced integration, you can delve into Zap's extensive configuration options to fine-tune your logging setup, tailoring it to fit the unique needs of your project.
As repositories and tools evolve, referencing the official Zap Logger documentation for the most up-to-date instructions is always a good idea. And when it's time to scale your application, platforms like AppMaster enable rapid backend development with no-code solutions, complementing your Go application with the power of automation.
Effective logging is critical for developing, debugging, and running Go applications. Zap Logger stands out for offering extensive configurability to fine-tune performance according to the needs of your application. Here we'll discuss optimizing Zap Logger to ensure you benefit from your logging efforts.
Fundamentally, configuration comes down to establishing a preferred level of detail in your logs and the performance trade-offs you're willing to make. High granularity in logging provides deeper insights but can slow down your application if not managed correctly. Conversely, too little logging detail might leave you in the dark when tracking issues. Let’s navigate the balance by addressing key configuration aspects.
With multiple levels of logging available, such as debug, info, warn, error, DPanic, panic, and fatal, setting the appropriate level for your needs is essential. For development, you might set a lower level like debug to capture more granular information. For production, a higher level such as error will focus on significant issues without cluttering your logs with unnecessary details.
Zap Logger allows developers to specify different output destinations such as standard output, files, or even network sockets. This flexibility enables you to direct logs where they will be most useful, whether that’s to the console during development or to a log management system in production. When targeting file outputs, ensure you're also considering log rotation to prevent logs from consuming excessive disk space.
Zap Logger supports both JSON and console-friendly text formats for logs, and choosing the right one is key for efficiency. JSON formatting is excellent for machine-readable logs and interfaces seamlessly with log processing systems, but for human readability during development, the console format may be more practical. Operators must weigh the cost of JSON parsing and serialization against the benefit of structured data when configuring this setting.
Large-scale applications might require log sampling to maintain high performance. Zap Logger's sampling configuration reduces the volume of logged entries without losing the picture. For production environments, it's also wise to configure a ProductionConfig with sensible defaults such as JSON encoding, info level logging, and no caller information to ensure minimal overhead.
For those who use the no-code platform AppMaster, integrating Zap Logger can enhance the out-of-the-box logging capabilities. Whether it's for the backend, web, or mobile applications developed with AppMaster, Zap Logger's advanced configuration options allow detailed logs without sacrificing the performance benefits of the no-code approach. This provides a comprehensive view of application behavior, which is especially beneficial in production environments where monitoring and debugging are critical.
Finally, Zap Logger has several advanced features such as custom log levels, runtime log level changes, and hooks that can call custom logic for each log entry. These advanced configurations help tailor logging to meet iterative requirements that may evolve with your application.
Zap Logger becomes a powerful tool that provides fine-grained control over your application logs using the right configuration settings. The end-goal is efficient logging that aligns with the specific demands of your Go applications, enhancing monitoring, analysis, and debugging capabilities while maintaining optimal application performance.
Effective logging is a cornerstone of any successful application, providing insights into its behavior and aiding in detecting and resolving issues. When utilizing Zap Logger with Go, a set of best practices can amplify the benefits of this powerful tool. Below, we outline strategies for leveraging Zap Logger to its full potential.
Logging levels are fundamental to understanding and sifting through log data. Zap Logger offers levels such as Debug, Info, Warn, Error, DPanic, Panic, and Fatal. Use the appropriate level to categorize log messages based on their severity and importance. For instance, reserve Error logs for issues that need immediate attention and Debug logs for verbose output helpful during development.
Zap Logger excels in structured logging, which means each log entry is consistent and machine-readable. Adopt a consistent logging schema with fields like time, level, message, and any relevant context-specific fields. Structured logs facilitate the analysis and querying of log data, which is invaluable during troubleshooting.
Logs with context are exponentially more useful. With Zap Logger, you can enrich logs using the With() method to add contextual information such as user ID, transaction ID, or other relevant data. This practice helps pinpoint issues and understand the application's state at the time of logging.
While logging is necessary, overlogging can have a detrimental effect on performance. Use Zap Logger's sampling feature to reduce the volume of less critical logs without losing visibility. You can also leverage asynchronous logging where it makes sense, to offload logging operations from critical application paths.
Managing the lifecycle of logs is crucial to prevent them from consuming excessive disk space or I/O resources. Employ external tools or services for log rotation and set appropriate retention policies. Ensure that these policies align with regulatory compliance and the operational needs of the application.
Zap Logger's structured logs are primed for monitoring and analysis tools integration. Forward logs to platforms like Elastic Stack or Datadog to visualize and monitor application health in real-time. This integration transforms logs from passive records into actionable data.
Logs often become a source for sensitive data leaks. Always sanitize logs to prevent exposure of personal, financial, or security information. You can use custom hooks in Zap Logger to filter out or mask sensitive data before it is written to the logs.
Regularly review your logs to ensure they provide the necessary insights. Periodic analysis can reveal patterns that might indicate underlying issues or areas for optimization. It's a good practice to have alerts set up for certain log patterns or thresholds to proactively handle potential problems.
Document your logging strategies and educate team members on best practices. A unified approach to logging across your development team ensures everyone contributes to the log's value. Training sessions can help elucidate the importance and usage of Zap Logger as an integral part of the workflow.
By following these best practices with Zap Logger, you can create a powerful logging strategy contributing to your Go applications' stability, maintainability, and performance. Remember, iterative improvement of your logging strategy based on application needs and evolving best practices will continue to enhance the value logs provide to your projects.
The performance impact is a fundamental concern when incorporating a logging library into your Go application. Developers must ensure that their choice of logger does not become the bottleneck, especially in high-throughput scenarios. This is where the Zap Logger does more than just impress — it excels. From the ground up, it's designed to be a high-performance library that can easily handle heavy logging requirements.
Benchmarking is crucial for understanding the real-world implications of using Zap Logger. It involves evaluating the library's performance in different scenarios, such as logging at various levels, logging structured data, and the speed at which it writes logs to various outputs, such as the console or a file.
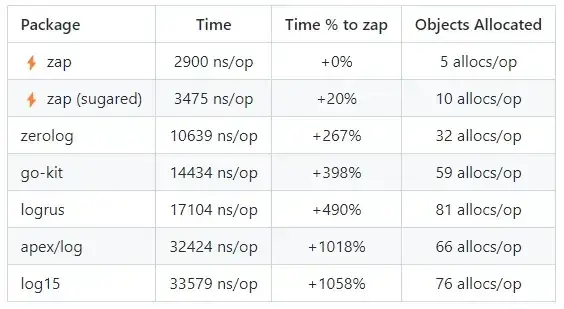
One of the standout features of Zap Logger is its minimal memory allocation. In logging, inefficient memory use can increase garbage collection, impacting the performance of Go applications. Benchmarks often reveal that Zap Logger allocates less memory per log message than other logging libraries. This means for developers is faster logging and reduced overhead regarding memory management.
Speed is another department where Zap Logger leads. Benchmark tests typically involve creating many log entries as rapidly as possible to measure throughput and latency. Zap Logger performs exceptionally well in these tests, easily outpacing conventional loggers. It achieves this efficiency through its unique design, which includes using pooled buffers and other optimizations to reduce the time spent on logging operations.
The performance of Zap Logger is also noticeable when switching between different logging levels. The ability to dynamically adjust logging granularity — such as switching from debug to error logs — without significant performance penalties, is pivotal for maintaining an efficient production environment. Benchmarking can help quantify the impact of these changes and compare Zap Logger's responsiveness in updating log levels on the fly.
It's not just about how quickly logs are processed, but also how they are structured and accessed. The benchmarks for Zap Logger often test its encoding performance—how effectively it can convert logs into JSON or other formats without sacrificing speed. This aspect is fundamental for ensuring the logs are compatible with log management tools for monitoring and analysis purposes.
In the context of benchmarking for speed and performance, comparison charts and graphs derived from profiling tools can visually demonstrate Zap Logger's supremacy in processing speed and resource efficiency. Developers can replicate these benchmarks using their real-world scenarios to predict the impact of integrating Zap Logger into their projects, fostering confidence in their logging solution choice.
The impressive benchmarks of Zap Logger reassure that even in the most demanding applications, logging will not be the weak link. The lightweight nature and lighting-fast performance establishes Zap Logger as a premier choice for developers seeking a reliable and speedy logging solution for their Go applications.
Zap Logger, a blazing-fast, structured logging library for Go, boasts of its performance and flexibility to tailor-fit the logging needs of various applications. Whether your application requires simple debug logs or intricate production-level monitoring, Zap Logger provides the tools needed to craft a logging strategy that aligns with your requirements.
To customize Zap Logger, a developer should delve into several aspects of its configuration. These include setting up log levels, output destinations, fields, encoding, and its integration with different systems.
zapcore.Field types allow you to inject standard and custom fields into your logs, ensuring all entries are informational and context-rich. This can include static values that are set during logger initialization or dynamic values that change over time.Zap also allows you to perform Sampling, controlling the volume of logs generated. This is particularly useful in production where you might only need a portion of all possible log messages to understand your system's behavior, thereby reducing disk and processing overhead.
Integration with monitoring and alerting tools is also vital. Thanks to its structured output, Zap Logger can seamlessly integrate with platforms like ElasticSearch, Splunk, and Datadog. Within Zap, you can set up "hooks" to trigger actions based on logging events, such as sending alerts or metrics to external systems when critical issues are logged.
To ensure you get the most out of Zap's customization features, it helps to have a solid understanding of your application's logging requirements and the capabilities of Zap. If you require further custom behavior, you can always extend Zap with your own components. For instance, integration with AppMaster can be achieved by creating a custom writer that pushes logs to the platform, taking advantage of AppMaster's infrastructure to manage and analyze application logs.
Zap Logger allows developers to define their logging strategy. Properly configuring Zap can reduce log noise, better insight into system behavior, and a more powerful monitoring setup. With these customization tools at your disposal, Zap Logger can mold to your unique logging needs, simplifying the essential task of keeping your Go applications transparent and healthy.
Zap Logger, a blazing-fast, structured logging library for Go, boasts theoretical benefits and has a proven track record in the tech world. Developers across various industry domains have implemented Zap Logger to address their critical logging needs. Here are a few practical case studies that illustrate how Zap Logger has been effectively utilized in real-world applications:
One of the largest E-commerce platforms confronted a significant challenge: with millions of transactions daily, the platform's logging system was faltering under high loads, causing delays and hindering issue diagnosis. By switching to Zap Logger, the platform drastically reduced log processing times and memory overhead. Zap's structured logging and asynchronous writing capabilities meant the platform could handle peak traffic without any performance bottlenecks, ensuring a smooth checkout process for users around the clock.

An innovative IoT company specializing in fleet management used Zap Logger to revamp their logging mechanism within their distributed devices network. The structured logging provided by Zap Logger made it easier to parse through vast amounts of logs emitted from devices spread worldwide. In addition, the low-latency logging facilitated real-time analysis and immediate response to critical system events, considerably improving the maintenance and monitoring of their IoT ecosystem.
Zap Logger played a transformative role in the financial sector, where high-frequency trading platforms demand speed and precision. A fintech company integrated Zap Logger to ensure their logging system could keep pace with the fast execution of trades and algorithms. The millisecond-level precision of Zap Logger's timestamps and its ability to log data rapidly without significant overhead allowed the company to audit and trace every transaction accurately and promptly, which is paramount in the highly regulated financial industry.
For a mobile gaming company, efficiency and real-time insights into application performance are crucial. Zap Logger came to the rescue by providing a way to swiftly log user interactions and server events without impacting the game performance. The company benefited from Zap Logger's speed and the structured nature of the logs, which played a crucial role in real-time analytics and helped fine-tune the user experience based on aggregated log data.
A leading telecommunications provider leveraged Zap Logger to optimize network operations and maintenance. With the vast amount of logs generated from network equipment, the team needed a solution that could cope with the high volume and velocity of log data. Zap Logger's ability to handle large-scale logging while preserving the readability and context of messages was instrumental in enhancing their capabilities to identify and resolve network issues more efficiently than ever before.
These case studies exemplify just a fraction of Zap Logger's potential in various industrial applications. From improving transaction speed in e-commerce to enabling real-time response in IoT solutions, from ensuring precision in financial services to boosting game performance in the gaming industry, Zap Logger has proven to be a versatile and indispensable tool for developers prioritizing efficiency and reliability in their logging systems.
While mentioning these real-world solutions, it's hard not to draw parallels with the logging capabilities of AppMaster. Just as Zap Logger provides an effective logging system for Go applications, AppMaster's no-code platform allows for seamless logging as part of the application development process, ensuring that developers can easily monitor and troubleshoot their applications. The platform’s use of visual modeling for database schemas and business process logic simplifies the creation of complex systems while ensuring efficient logging mechanisms are always in place.
Integrating any logging library into your application can come with its hurdles. In the case of Zap Logger, while it's prized for its efficiency and flexibility, developers may occasionally encounter issues either during initial setup or during normal application usage. Let's go through some common challenges and provide practical solutions to troubleshoot these issues.
One of the first hurdles might come from attempting to write logs to a file without the proper permissions or if the file path doesn't exist. To resolve this:
Another common issue is that logs are not outputting appropriately (e.g., debug logs not appearing when they should). This could be due to incorrect logger configuration. Ensure the following:
zapcore.LevelEnablerFunc.Structured logs can sometimes become messy or improperly formatted. This is often an issue with how the log entries are constructed. To debug:
logger.With(...).ObjectMarshaler implementations for correctness.In high throughput scenarios, logging can sometimes appear to slow down the application. This can arise for multiple reasons:
Issues with timestamps are common in logging systems, especially when the logs are intended for a centralized logging system across different time zones. Make sure to:
Loggers might fail to initialize properly early in application startup due to configuration errors or missing dependencies. Check for these conditions:
zap.RegisterSink, confirm that all necessary sinks are registered before initializing the logger.Import conflicts can also manifest as issues, particularly if there are multiple logging libraries or different versions of Zap Logger in use within the same application. To troubleshoot:
By watching for these common pitfalls, and applying strategic troubleshooting methods, you can maintain the integrity of your logging system and leverage the full power of Zap Logger in your Go applications. Even with the best practices in place, sometimes a fresh perspective is needed for complex issues, making community forums and official documentation invaluable resources for developers.
In specific scenarios that demand the generation of source code, platforms like AppMaster can be a boon, allowing you to switch from troubleshooting to a no-code approach for various application components, seamlessly integrating customization and automation while reducing the need for manual intervention in the development process.
When logging in Go, developers are spoiled for choice with various logging libraries available. Each offers distinct features, performance traits, and customization options. Let's look at how Zap Logger does compared with other prominent logging libraries in the Go ecosystem.
Zap is renowned for its blazing-fast performance, primarily owing to its focus on minimizing memory allocations and CPU overhead. It positions itself as a high-speed logging solution, particularly beneficial when log generation is a frequent operation.
One popular alternative to Zap is logrus, which has become a go-to for many Go developers due to its friendly API and extensibility with hooks. While logrus excels in these areas, Zap edges out logrus in performance benchmarks, primarily due to Zap's optimized encoding and logging routines.
Another competitor in the logging space is glog, which was inspired by Google's own logging module. Glog offers practical performance and simple file-based logging but lacks the structured and leveled logging that Zap provides. Moreover, customization and extensibility options in glog are not as vast as those available in Zap.
For developers prioritizing modularity, zerolog proves to be a strong contender. It provides a zero-allocation JSON logger that's especially fast and useful for applications with high performance needs. Zerolog and Zap share commonalities in speed and efficiency, making them both excellent choices for applications where performance is critical.
There's also go-kit/log, which is part of the larger go-kit framework designed to handle the complexities of microservices. Go-kit/log offers a powerful set of features for structured logging but leans towards verbosity and complexity. Developers looking for simplicity and raw speed may find Zap more suitable.
Last but not least, Go's standard library log package is always an option for basic logging needs. Still, it falls short when it comes to structured and leveled logging, and it doesn't offer the same performance enhancements as specialized libraries like Zap.
One aspect to consider when choosing a logging library is the existing ecosystem and how it integrates with other tools. A platform like AppMaster could factor into this decision, as it generates Go source code using tools and libraries that fit into their efficient, no-code approach to application development. Being aware of the capabilities of the platform and the generated code's requirements can help select a logging library that aligns with both the platform's and the application's performance and structure goals.
While many Go logging libraries offer a range of functionalities, Zap Logger stands out for its impressive speed and efficiency. Its capability for structured logging makes it an attractive choice for modern applications that require performant, discernible logs. The choice of a logging library should be informed by the specific needs of the application, compatibility with existing infrastructure, performance requirements, and personal preferences of the development team.
Choosing the right tool is a critical decision, and while Zap might be the superior choice for high-performance needs, evaluating all options to find the best fit will ensure logging works for, rather than against, your application's success.
The open-source nature of the Zap Logger project encourages continual improvement and evolution, with contributions coming from a global community of developers. Looking towards the future, the Zap Logger project is set on a path of incremental enhancements, optimizations, and integrations.
The core team behind Zap Logger prioritizes maintaining the delicate balance between offering advanced features and preserving the tool's renowned performance. Potential areas of feature expansion include more sophisticated log rotation mechanisms, tighter integration with cloud-based logging services, and enhanced machine learning capabilities for predictive log analysis.
Community contributions have played a crucial role in shaping the current state of Zap Logger. Developers who use Zap Logger in their projects often identify unique edge cases, performance bottlenecks, or new use cases that can lead to improvements in the library. By addressing issues, proposing new features, or refining the existing codebase through pull requests, community members help to ensure that Zap Logger remains responsive to real-world development needs.
The project also benefits from community-led documentation efforts, tutorials, and even plugins or extensions that extend the functionality of Zap Logger. These contributions, often shared on platforms like GitHub, not only expand the utility of Zap Logger but also foster an environment where knowledge and expertise are freely exchanged.
For those interested in contributing to the future developments of Zap Logger, engaging with the community through forums, issue trackers, and direct contributions is encouraged. By doing so, developers can influence the direction of the tool and ensure that it continues to serve the needs of the Go programming community effectively.
It's also worth noting that the logging capabilities developed through Zap Logger and other similar tools can be integral to platforms like AppMaster, enabling developers to monitor and troubleshoot applications in real time. Having a powerful logging tool bundled into a no-code/low-code platform like AppMaster enhances the experience and reliability for both developers and system administrators managing applications at scale.
When it comes to developing applications in Go, it's not just about writing functional code. It's about creating a system that is maintainable, scalable, and easy to debug. Logging is a pivotal aspect of that system, providing insights into application behavior and aiding in quick issue resolution. This is where Zap Logger steps in as a game-changer, setting a new standard for efficient and effective logging in Go applications.
By choosing Zap Logger for your next project, you'll benefit from its lightning-fast speeds, due to minimized memory allocations and optimized log processing practices. It's a tool built for performance, ensuring the logging process doesn't become a bottleneck, even for applications under heavy loads. Its structured logging methodology isn't just about capturing text; it's about creating logs that are structured in a way that machines can parse and that human operators can understand at a glance.
Customization possibilities with Zap Logger are extensive, allowing developers to tailor logging details to the exact specifications of any project. Whether changing log levels dynamically, integrating with different output formats like JSON, or setting up hooks for complex logging pipelines, Zap Logger provides the flexibility needed in modern development practices.
Moreover, the ease of integration into your existing Go project means you can start leveraging the benefits of Zap Logger without a significant overhead or learning curve. Selecting the right tool becomes crucial as the need for more efficient and structured logging grows with each passing day. With its performance benefits, customization options, and ease of use, Zap Logger proves to be that tool time and time again.
Zap Logger is a vital component in the Go developer's toolkit. As you develop your next Go application, consider Zap Logger not just for its individual features, but for how it can enhance your development workflow, maintainability, and ability to diagnose and respond to issues rapidly. It encapsulates what modern logging should be - fast, flexible, and forward-thinking. As logging requirements evolve alongside ever-growing applications, Zap Logger is poised to help you log smarter, not harder.
Zap Logger is a high-performance structured logging library tailored for Go applications, offering fast, leveled, and structured logging.
Zap Logger optimizes Go application logging by providing a spectrum of logging levels, structured logs for easy analysis, and high-speed log processing.
Yes, Zap Logger is designed with production environments in mind, delivering efficient logging without compromising application performance.
Certainly. Zap Logger allows developers to customize various aspects such as log levels, output destinations, and encoding formats to meet specific requirements.
Yes, Zap Logger inherently supports structured logging, which helps developers and systems to easily parse and understand log data.
Zap Logger can be installed by using the go get command to fetch the library from its repository and then adding it to your Go project.
Zap Logger offers performance benefits like minimized memory allocations and faster log processing, which is crucial for high-load applications.
Zap Logger stands out for its speed and structured logging features, often performing better compared to other popular Go logging libraries.
Yes, the structured logging format of Zap Logger makes it easy to integrate with various monitoring and log analysis tools.
Zap Logger has an active community on platforms like GitHub where you can seek assistance and contribute to the library's future development.
Absolutely, contributions to the Zap Logger project are welcome, and developers can contribute through GitHub by submitting issues or pull requests.
Yes, Zap Logger supports a range of output formats, including JSON, which can be easily configured according to the developer's preference.
Experiment with AppMaster with free plan.
When you will be ready you can choose the proper subscription.


